Taiwanese vs Mongolian Male Poverty
COMPARE
Taiwanese
Mongolian
Male Poverty
Male Poverty Comparison
Taiwanese
Mongolians
11.0%
MALE POVERTY
62.7/ 100
METRIC RATING
159th/ 347
METRIC RANK
11.3%
MALE POVERTY
39.0/ 100
METRIC RATING
182nd/ 347
METRIC RANK
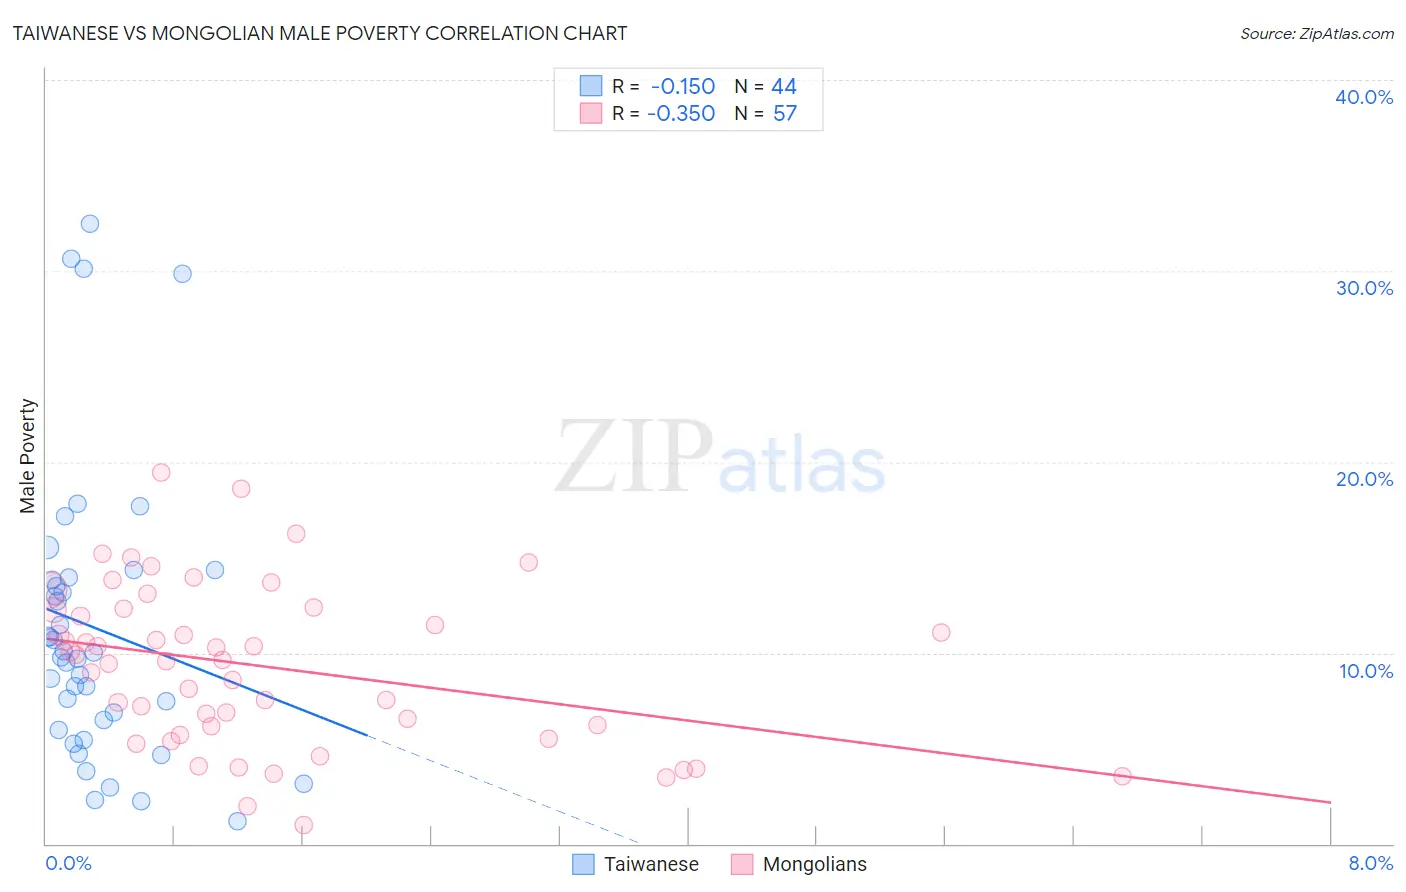
Taiwanese vs Mongolian Male Poverty Correlation Chart
The statistical analysis conducted on geographies consisting of 31,715,286 people shows a poor negative correlation between the proportion of Taiwanese and poverty level among males in the United States with a correlation coefficient (R) of -0.150 and weighted average of 11.0%. Similarly, the statistical analysis conducted on geographies consisting of 140,285,777 people shows a mild negative correlation between the proportion of Mongolians and poverty level among males in the United States with a correlation coefficient (R) of -0.350 and weighted average of 11.3%, a difference of 2.4%.
Male Poverty Correlation Summary
| Measurement | Taiwanese | Mongolian |
| Minimum | 1.2% | 0.97% |
| Maximum | 32.5% | 19.4% |
| Range | 31.3% | 18.5% |
| Mean | 11.3% | 9.3% |
| Median | 9.9% | 9.6% |
| Interquartile 25% (IQ1) | 6.2% | 5.9% |
| Interquartile 75% (IQ3) | 13.9% | 12.3% |
| Interquartile Range (IQR) | 7.6% | 6.4% |
| Standard Deviation (Sample) | 7.6% | 4.2% |
| Standard Deviation (Population) | 7.5% | 4.2% |
Similar Demographics by Male Poverty
Demographics Similar to Taiwanese by Male Poverty
In terms of male poverty, the demographic groups most similar to Taiwanese are Colombian (11.0%, a difference of 0.030%), Scotch-Irish (11.0%, a difference of 0.10%), Costa Rican (11.0%, a difference of 0.12%), Immigrants from Kazakhstan (11.0%, a difference of 0.22%), and Immigrants from Malaysia (11.0%, a difference of 0.22%).
| Demographics | Rating | Rank | Male Poverty |
| Immigrants | Nepal | 67.3 /100 | #152 | Good 11.0% |
| Immigrants | Bosnia and Herzegovina | 65.2 /100 | #153 | Good 11.0% |
| Immigrants | Kazakhstan | 64.8 /100 | #154 | Good 11.0% |
| Immigrants | Malaysia | 64.7 /100 | #155 | Good 11.0% |
| Costa Ricans | 63.9 /100 | #156 | Good 11.0% |
| Scotch-Irish | 63.7 /100 | #157 | Good 11.0% |
| Colombians | 63.0 /100 | #158 | Good 11.0% |
| Taiwanese | 62.7 /100 | #159 | Good 11.0% |
| Soviet Union | 60.3 /100 | #160 | Good 11.1% |
| Immigrants | Northern Africa | 59.7 /100 | #161 | Average 11.1% |
| Immigrants | Chile | 57.4 /100 | #162 | Average 11.1% |
| Whites/Caucasians | 56.7 /100 | #163 | Average 11.1% |
| Ethiopians | 56.7 /100 | #164 | Average 11.1% |
| Immigrants | Spain | 55.5 /100 | #165 | Average 11.1% |
| Immigrants | Albania | 55.3 /100 | #166 | Average 11.1% |
Demographics Similar to Mongolians by Male Poverty
In terms of male poverty, the demographic groups most similar to Mongolians are Immigrants from Costa Rica (11.3%, a difference of 0.050%), Kenyan (11.3%, a difference of 0.060%), Immigrants from Morocco (11.3%, a difference of 0.11%), Immigrants from Syria (11.3%, a difference of 0.13%), and Immigrants from South America (11.3%, a difference of 0.22%).
| Demographics | Rating | Rank | Male Poverty |
| Celtics | 47.5 /100 | #175 | Average 11.2% |
| Immigrants | Fiji | 46.0 /100 | #176 | Average 11.2% |
| Lebanese | 45.6 /100 | #177 | Average 11.2% |
| Immigrants | Cameroon | 44.5 /100 | #178 | Average 11.2% |
| Immigrants | Syria | 40.3 /100 | #179 | Average 11.3% |
| Immigrants | Morocco | 40.1 /100 | #180 | Average 11.3% |
| Immigrants | Costa Rica | 39.5 /100 | #181 | Fair 11.3% |
| Mongolians | 39.0 /100 | #182 | Fair 11.3% |
| Kenyans | 38.4 /100 | #183 | Fair 11.3% |
| Immigrants | South America | 36.9 /100 | #184 | Fair 11.3% |
| Immigrants | Afghanistan | 33.3 /100 | #185 | Fair 11.4% |
| Immigrants | Sierra Leone | 32.9 /100 | #186 | Fair 11.4% |
| Immigrants | Iraq | 31.9 /100 | #187 | Fair 11.4% |
| Sierra Leoneans | 29.9 /100 | #188 | Fair 11.4% |
| Hawaiians | 28.3 /100 | #189 | Fair 11.4% |