Taiwanese vs Afghan In Labor Force | Age 20-24
COMPARE
Taiwanese
Afghan
In Labor Force | Age 20-24
In Labor Force | Age 20-24 Comparison
Taiwanese
Afghans
74.7%
IN LABOR FORCE | AGE 20-24
23.2/ 100
METRIC RATING
199th/ 347
METRIC RANK
75.2%
IN LABOR FORCE | AGE 20-24
63.5/ 100
METRIC RATING
165th/ 347
METRIC RANK
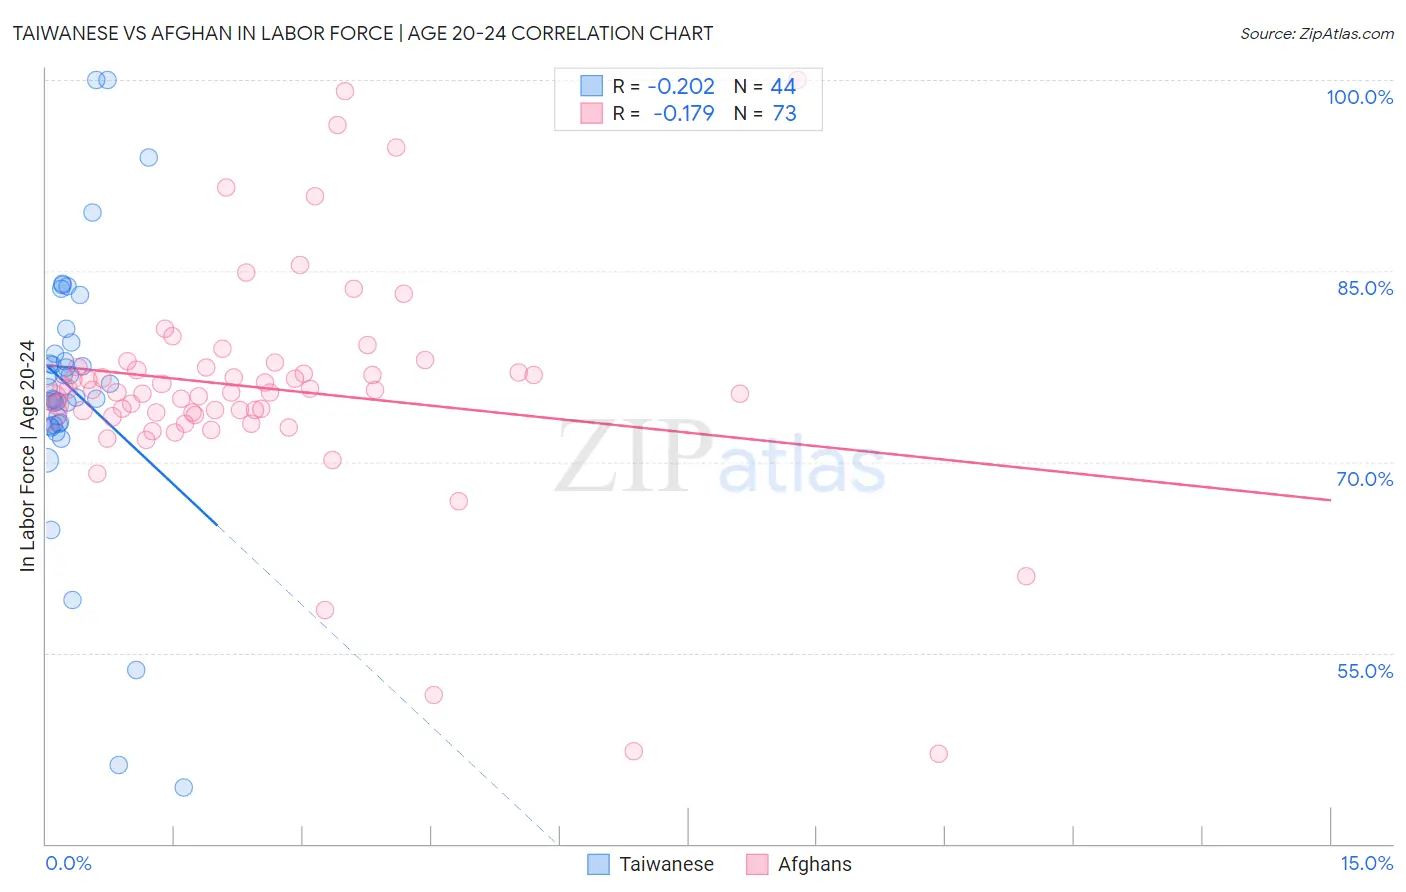
Taiwanese vs Afghan In Labor Force | Age 20-24 Correlation Chart
The statistical analysis conducted on geographies consisting of 31,724,936 people shows a weak negative correlation between the proportion of Taiwanese and labor force participation rate among population between the ages 20 and 24 in the United States with a correlation coefficient (R) of -0.202 and weighted average of 74.7%. Similarly, the statistical analysis conducted on geographies consisting of 148,869,972 people shows a poor negative correlation between the proportion of Afghans and labor force participation rate among population between the ages 20 and 24 in the United States with a correlation coefficient (R) of -0.179 and weighted average of 75.2%, a difference of 0.64%.
In Labor Force | Age 20-24 Correlation Summary
| Measurement | Taiwanese | Afghan |
| Minimum | 44.4% | 47.1% |
| Maximum | 100.0% | 100.0% |
| Range | 55.6% | 52.9% |
| Mean | 75.7% | 75.8% |
| Median | 75.4% | 75.5% |
| Interquartile 25% (IQ1) | 73.0% | 73.8% |
| Interquartile 75% (IQ3) | 78.9% | 77.4% |
| Interquartile Range (IQR) | 6.0% | 3.6% |
| Standard Deviation (Sample) | 10.7% | 9.0% |
| Standard Deviation (Population) | 10.6% | 8.9% |
Similar Demographics by In Labor Force | Age 20-24
Demographics Similar to Taiwanese by In Labor Force | Age 20-24
In terms of in labor force | age 20-24, the demographic groups most similar to Taiwanese are Immigrants from Nigeria (74.7%, a difference of 0.020%), Nigerian (74.7%, a difference of 0.030%), Eastern European (74.8%, a difference of 0.040%), Immigrants from Vietnam (74.7%, a difference of 0.040%), and Panamanian (74.7%, a difference of 0.040%).
| Demographics | Rating | Rank | In Labor Force | Age 20-24 |
| Immigrants | Europe | 27.5 /100 | #192 | Fair 74.8% |
| Alsatians | 27.1 /100 | #193 | Fair 74.8% |
| Immigrants | Denmark | 25.8 /100 | #194 | Fair 74.8% |
| Eastern Europeans | 25.4 /100 | #195 | Fair 74.8% |
| Immigrants | Vietnam | 25.1 /100 | #196 | Fair 74.7% |
| Panamanians | 25.0 /100 | #197 | Fair 74.7% |
| Immigrants | Nigeria | 24.2 /100 | #198 | Fair 74.7% |
| Taiwanese | 23.2 /100 | #199 | Fair 74.7% |
| Nigerians | 21.9 /100 | #200 | Fair 74.7% |
| Choctaw | 21.4 /100 | #201 | Fair 74.7% |
| Moroccans | 20.4 /100 | #202 | Fair 74.7% |
| Immigrants | Northern Africa | 17.9 /100 | #203 | Poor 74.6% |
| Immigrants | Italy | 17.6 /100 | #204 | Poor 74.6% |
| Inupiat | 17.6 /100 | #205 | Poor 74.6% |
| Sioux | 17.5 /100 | #206 | Poor 74.6% |
Demographics Similar to Afghans by In Labor Force | Age 20-24
In terms of in labor force | age 20-24, the demographic groups most similar to Afghans are Costa Rican (75.2%, a difference of 0.010%), Bolivian (75.2%, a difference of 0.010%), Immigrants from Romania (75.2%, a difference of 0.020%), New Zealander (75.2%, a difference of 0.030%), and Cambodian (75.2%, a difference of 0.050%).
| Demographics | Rating | Rank | In Labor Force | Age 20-24 |
| Immigrants | Bolivia | 71.0 /100 | #158 | Good 75.3% |
| South American Indians | 69.0 /100 | #159 | Good 75.3% |
| Japanese | 68.7 /100 | #160 | Good 75.3% |
| New Zealanders | 65.4 /100 | #161 | Good 75.2% |
| Immigrants | Romania | 64.6 /100 | #162 | Good 75.2% |
| Costa Ricans | 64.2 /100 | #163 | Good 75.2% |
| Bolivians | 64.0 /100 | #164 | Good 75.2% |
| Afghans | 63.5 /100 | #165 | Good 75.2% |
| Cambodians | 60.5 /100 | #166 | Good 75.2% |
| Immigrants | South Eastern Asia | 57.5 /100 | #167 | Average 75.1% |
| Immigrants | Western Africa | 56.7 /100 | #168 | Average 75.1% |
| Immigrants | Philippines | 55.8 /100 | #169 | Average 75.1% |
| Mexicans | 52.1 /100 | #170 | Average 75.1% |
| Cajuns | 51.1 /100 | #171 | Average 75.1% |
| Yakama | 50.8 /100 | #172 | Average 75.1% |