Immigrants from Albania vs Paraguayan Receiving Food Stamps
COMPARE
Immigrants from Albania
Paraguayan
Receiving Food Stamps
Receiving Food Stamps Comparison
Immigrants from Albania
Paraguayans
13.0%
RECEIVING FOOD STAMPS
4.4/ 100
METRIC RATING
223rd/ 347
METRIC RANK
10.7%
RECEIVING FOOD STAMPS
93.0/ 100
METRIC RATING
124th/ 347
METRIC RANK
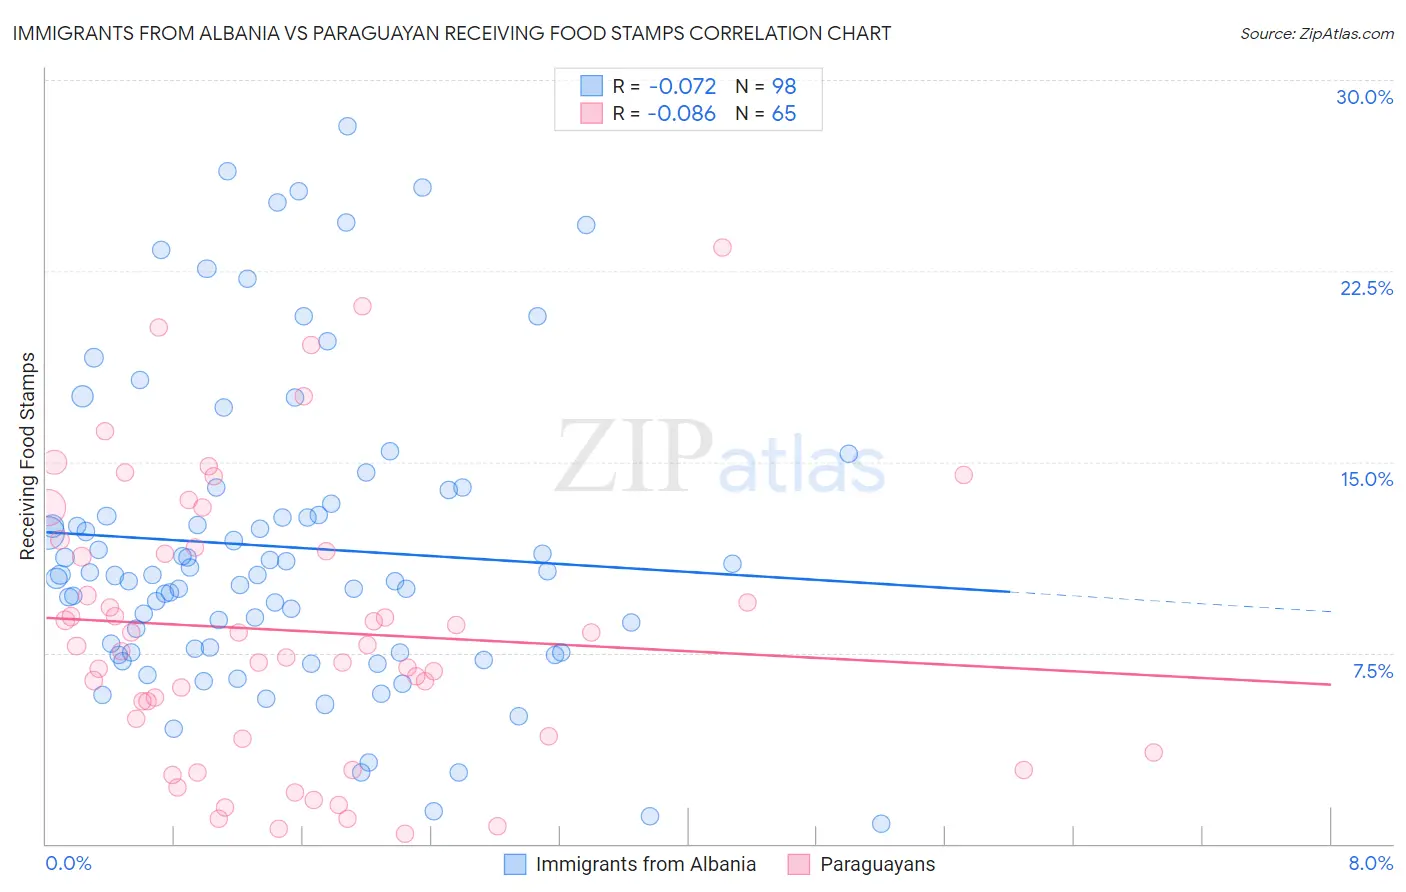
Immigrants from Albania vs Paraguayan Receiving Food Stamps Correlation Chart
The statistical analysis conducted on geographies consisting of 119,244,585 people shows a slight negative correlation between the proportion of Immigrants from Albania and percentage of population receiving government assistance and/or food stamps in the United States with a correlation coefficient (R) of -0.072 and weighted average of 13.0%. Similarly, the statistical analysis conducted on geographies consisting of 95,051,783 people shows a slight negative correlation between the proportion of Paraguayans and percentage of population receiving government assistance and/or food stamps in the United States with a correlation coefficient (R) of -0.086 and weighted average of 10.7%, a difference of 21.8%.
Receiving Food Stamps Correlation Summary
| Measurement | Immigrants from Albania | Paraguayan |
| Minimum | 0.80% | 0.40% |
| Maximum | 28.2% | 23.4% |
| Range | 27.4% | 23.0% |
| Mean | 11.7% | 8.4% |
| Median | 10.6% | 7.8% |
| Interquartile 25% (IQ1) | 7.5% | 4.2% |
| Interquartile 75% (IQ3) | 13.3% | 11.6% |
| Interquartile Range (IQR) | 5.8% | 7.4% |
| Standard Deviation (Sample) | 6.0% | 5.4% |
| Standard Deviation (Population) | 6.0% | 5.4% |
Similar Demographics by Receiving Food Stamps
Demographics Similar to Immigrants from Albania by Receiving Food Stamps
In terms of receiving food stamps, the demographic groups most similar to Immigrants from Albania are Immigrants (13.0%, a difference of 0.040%), Immigrants from Armenia (13.0%, a difference of 0.070%), Fijian (13.0%, a difference of 0.090%), Bermudan (13.0%, a difference of 0.30%), and Immigrants from Colombia (12.9%, a difference of 0.62%).
| Demographics | Rating | Rank | Receiving Food Stamps |
| Immigrants | South America | 6.5 /100 | #216 | Tragic 12.8% |
| Immigrants | Burma/Myanmar | 6.0 /100 | #217 | Tragic 12.9% |
| Hawaiians | 5.4 /100 | #218 | Tragic 12.9% |
| Immigrants | Middle Africa | 5.4 /100 | #219 | Tragic 12.9% |
| Immigrants | Colombia | 5.3 /100 | #220 | Tragic 12.9% |
| Bermudans | 4.8 /100 | #221 | Tragic 13.0% |
| Immigrants | Immigrants | 4.4 /100 | #222 | Tragic 13.0% |
| Immigrants | Albania | 4.4 /100 | #223 | Tragic 13.0% |
| Immigrants | Armenia | 4.3 /100 | #224 | Tragic 13.0% |
| Fijians | 4.3 /100 | #225 | Tragic 13.0% |
| Chickasaw | 3.6 /100 | #226 | Tragic 13.1% |
| Nigerians | 3.5 /100 | #227 | Tragic 13.1% |
| Panamanians | 3.5 /100 | #228 | Tragic 13.1% |
| Ottawa | 3.5 /100 | #229 | Tragic 13.1% |
| Puget Sound Salish | 3.4 /100 | #230 | Tragic 13.1% |
Demographics Similar to Paraguayans by Receiving Food Stamps
In terms of receiving food stamps, the demographic groups most similar to Paraguayans are Ukrainian (10.7%, a difference of 0.080%), Immigrants from Philippines (10.7%, a difference of 0.21%), Afghan (10.7%, a difference of 0.22%), Immigrants from Ethiopia (10.7%, a difference of 0.25%), and Immigrants from Jordan (10.7%, a difference of 0.26%).
| Demographics | Rating | Rank | Receiving Food Stamps |
| Immigrants | Nepal | 94.6 /100 | #117 | Exceptional 10.6% |
| Assyrians/Chaldeans/Syriacs | 94.1 /100 | #118 | Exceptional 10.6% |
| Immigrants | Poland | 93.9 /100 | #119 | Exceptional 10.6% |
| Ethiopians | 93.9 /100 | #120 | Exceptional 10.6% |
| Slavs | 93.8 /100 | #121 | Exceptional 10.6% |
| Sri Lankans | 93.7 /100 | #122 | Exceptional 10.6% |
| Immigrants | Philippines | 93.3 /100 | #123 | Exceptional 10.7% |
| Paraguayans | 93.0 /100 | #124 | Exceptional 10.7% |
| Ukrainians | 92.8 /100 | #125 | Exceptional 10.7% |
| Afghans | 92.6 /100 | #126 | Exceptional 10.7% |
| Immigrants | Ethiopia | 92.6 /100 | #127 | Exceptional 10.7% |
| Immigrants | Jordan | 92.5 /100 | #128 | Exceptional 10.7% |
| Yugoslavians | 92.5 /100 | #129 | Exceptional 10.7% |
| Israelis | 92.4 /100 | #130 | Exceptional 10.7% |
| French | 92.3 /100 | #131 | Exceptional 10.7% |