Immigrants from Germany vs Hmong Child Poverty Among Boys Under 16
COMPARE
Immigrants from Germany
Hmong
Child Poverty Among Boys Under 16
Child Poverty Among Boys Under 16 Comparison
Immigrants from Germany
Hmong
16.2%
CHILD POVERTY AMONG BOYS UNDER 16
63.6/ 100
METRIC RATING
166th/ 347
METRIC RANK
16.6%
CHILD POVERTY AMONG BOYS UNDER 16
38.4/ 100
METRIC RATING
186th/ 347
METRIC RANK
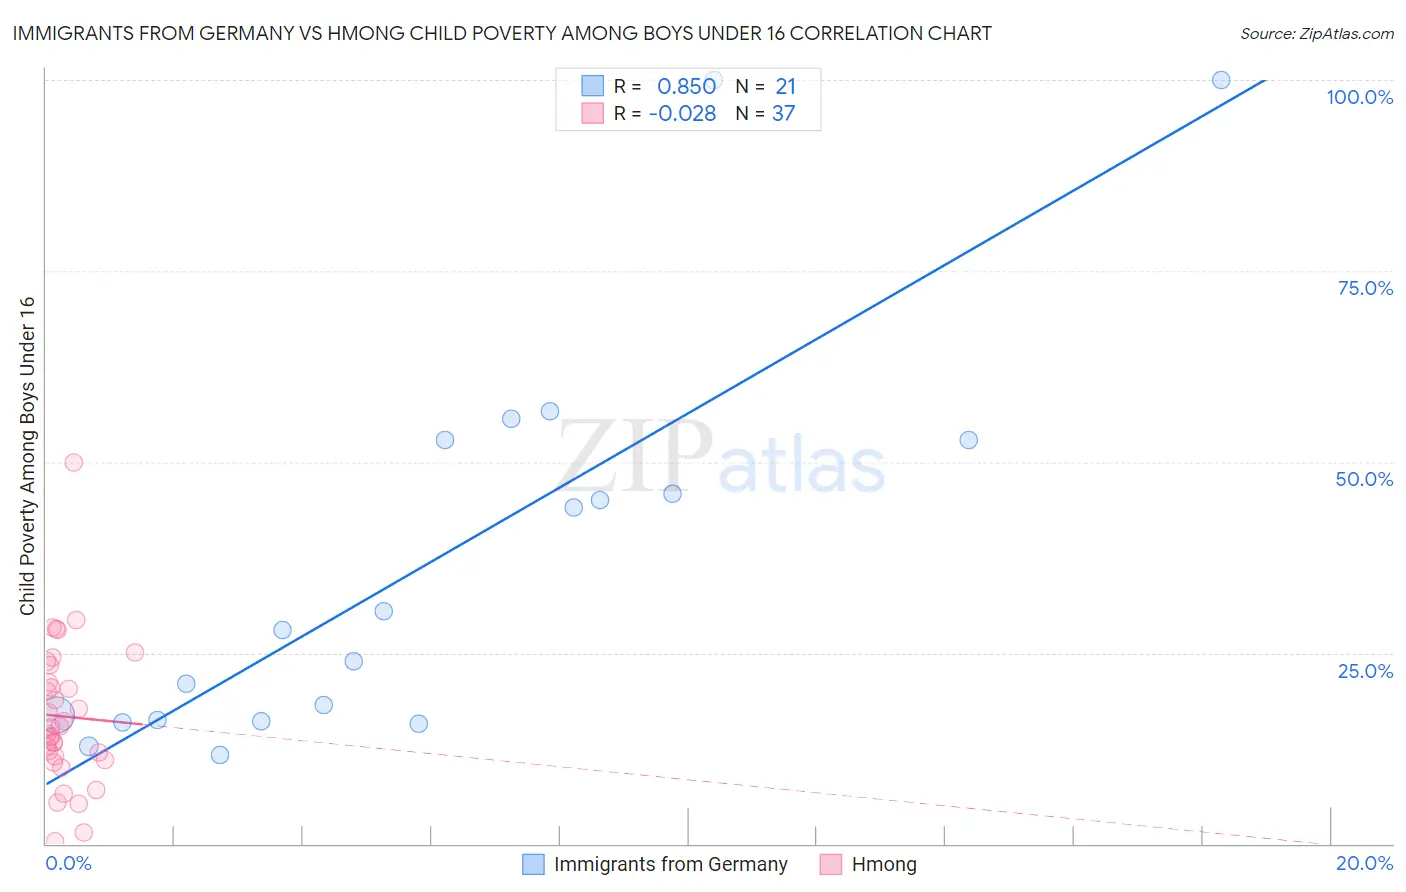
Immigrants from Germany vs Hmong Child Poverty Among Boys Under 16 Correlation Chart
The statistical analysis conducted on geographies consisting of 453,739,564 people shows a very strong positive correlation between the proportion of Immigrants from Germany and poverty level among boys under the age of 16 in the United States with a correlation coefficient (R) of 0.850 and weighted average of 16.2%. Similarly, the statistical analysis conducted on geographies consisting of 24,651,420 people shows no correlation between the proportion of Hmong and poverty level among boys under the age of 16 in the United States with a correlation coefficient (R) of -0.028 and weighted average of 16.6%, a difference of 2.9%.
Child Poverty Among Boys Under 16 Correlation Summary
| Measurement | Immigrants from Germany | Hmong |
| Minimum | 11.6% | 0.39% |
| Maximum | 100.0% | 49.8% |
| Range | 88.4% | 49.5% |
| Mean | 37.1% | 16.7% |
| Median | 28.0% | 15.1% |
| Interquartile 25% (IQ1) | 16.1% | 11.2% |
| Interquartile 75% (IQ3) | 52.9% | 22.3% |
| Interquartile Range (IQR) | 36.8% | 11.1% |
| Standard Deviation (Sample) | 26.2% | 9.3% |
| Standard Deviation (Population) | 25.5% | 9.2% |
Demographics Similar to Immigrants from Germany and Hmong by Child Poverty Among Boys Under 16
In terms of child poverty among boys under 16, the demographic groups most similar to Immigrants from Germany are Afghan (16.3%, a difference of 0.97%), South American (16.3%, a difference of 0.98%), Immigrants from Saudi Arabia (16.4%, a difference of 1.2%), Immigrants from Bosnia and Herzegovina (16.4%, a difference of 1.4%), and Immigrants from Ethiopia (16.4%, a difference of 1.4%). Similarly, the demographic groups most similar to Hmong are Immigrants from Western Asia (16.6%, a difference of 0.22%), Celtic (16.6%, a difference of 0.25%), Kenyan (16.6%, a difference of 0.29%), Lebanese (16.6%, a difference of 0.56%), and South American Indian (16.5%, a difference of 0.67%).
| Demographics | Rating | Rank | Child Poverty Among Boys Under 16 |
| Immigrants | Germany | 63.6 /100 | #166 | Good 16.2% |
| Afghans | 55.4 /100 | #167 | Average 16.3% |
| South Americans | 55.3 /100 | #168 | Average 16.3% |
| Immigrants | Saudi Arabia | 53.6 /100 | #169 | Average 16.4% |
| Immigrants | Bosnia and Herzegovina | 51.7 /100 | #170 | Average 16.4% |
| Immigrants | Ethiopia | 51.3 /100 | #171 | Average 16.4% |
| Immigrants | Colombia | 50.8 /100 | #172 | Average 16.4% |
| Tsimshian | 50.5 /100 | #173 | Average 16.4% |
| Uruguayans | 50.0 /100 | #174 | Average 16.4% |
| Immigrants | Syria | 49.0 /100 | #175 | Average 16.5% |
| Whites/Caucasians | 48.2 /100 | #176 | Average 16.5% |
| Ethiopians | 47.8 /100 | #177 | Average 16.5% |
| Scotch-Irish | 47.5 /100 | #178 | Average 16.5% |
| Hungarians | 47.3 /100 | #179 | Average 16.5% |
| Hawaiians | 45.5 /100 | #180 | Average 16.5% |
| South American Indians | 44.3 /100 | #181 | Average 16.5% |
| Lebanese | 43.3 /100 | #182 | Average 16.6% |
| Kenyans | 41.0 /100 | #183 | Average 16.6% |
| Celtics | 40.6 /100 | #184 | Average 16.6% |
| Immigrants | Western Asia | 40.4 /100 | #185 | Average 16.6% |
| Hmong | 38.4 /100 | #186 | Fair 16.6% |