Swiss vs Panamanian Male Poverty
COMPARE
Swiss
Panamanian
Male Poverty
Male Poverty Comparison
Swiss
Panamanians
10.2%
MALE POVERTY
97.5/ 100
METRIC RATING
64th/ 347
METRIC RANK
11.9%
MALE POVERTY
6.2/ 100
METRIC RATING
205th/ 347
METRIC RANK
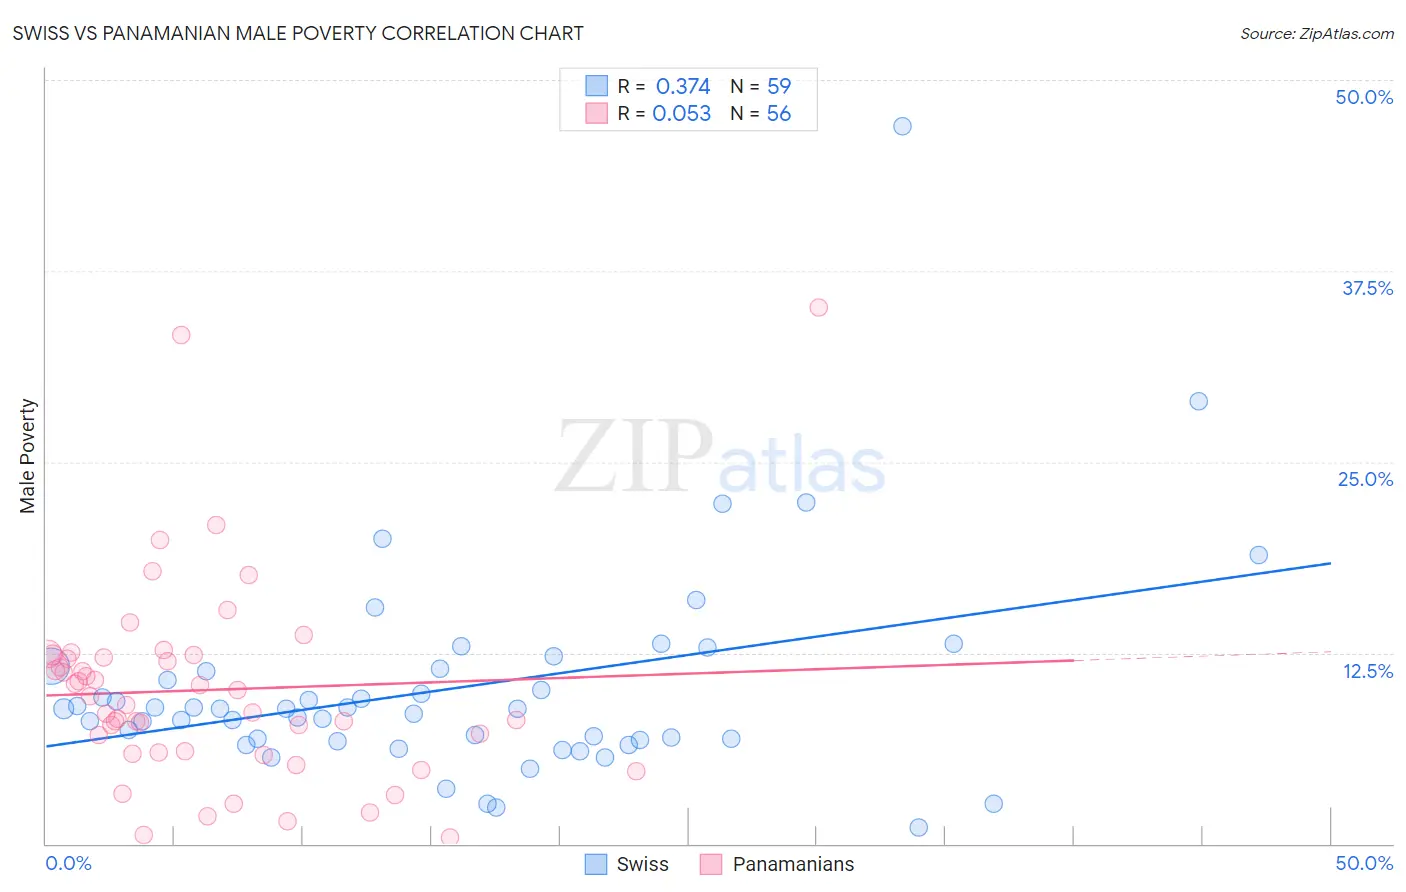
Swiss vs Panamanian Male Poverty Correlation Chart
The statistical analysis conducted on geographies consisting of 464,423,995 people shows a mild positive correlation between the proportion of Swiss and poverty level among males in the United States with a correlation coefficient (R) of 0.374 and weighted average of 10.2%. Similarly, the statistical analysis conducted on geographies consisting of 281,029,832 people shows a slight positive correlation between the proportion of Panamanians and poverty level among males in the United States with a correlation coefficient (R) of 0.053 and weighted average of 11.9%, a difference of 17.2%.
Male Poverty Correlation Summary
| Measurement | Swiss | Panamanian |
| Minimum | 1.1% | 0.40% |
| Maximum | 47.0% | 35.1% |
| Range | 45.9% | 34.7% |
| Mean | 10.2% | 10.1% |
| Median | 8.8% | 9.4% |
| Interquartile 25% (IQ1) | 6.8% | 6.0% |
| Interquartile 75% (IQ3) | 11.4% | 12.2% |
| Interquartile Range (IQR) | 4.7% | 6.2% |
| Standard Deviation (Sample) | 7.0% | 6.5% |
| Standard Deviation (Population) | 6.9% | 6.5% |
Similar Demographics by Male Poverty
Demographics Similar to Swiss by Male Poverty
In terms of male poverty, the demographic groups most similar to Swiss are Zimbabwean (10.2%, a difference of 0.070%), Serbian (10.2%, a difference of 0.080%), Slovak (10.2%, a difference of 0.24%), Immigrants from Netherlands (10.2%, a difference of 0.25%), and Immigrants from Italy (10.2%, a difference of 0.28%).
| Demographics | Rating | Rank | Male Poverty |
| Estonians | 98.1 /100 | #57 | Exceptional 10.1% |
| Scandinavians | 98.0 /100 | #58 | Exceptional 10.1% |
| Immigrants | Europe | 97.9 /100 | #59 | Exceptional 10.1% |
| Ukrainians | 97.9 /100 | #60 | Exceptional 10.1% |
| Austrians | 97.8 /100 | #61 | Exceptional 10.1% |
| Immigrants | Italy | 97.8 /100 | #62 | Exceptional 10.2% |
| Slovaks | 97.7 /100 | #63 | Exceptional 10.2% |
| Swiss | 97.5 /100 | #64 | Exceptional 10.2% |
| Zimbabweans | 97.5 /100 | #65 | Exceptional 10.2% |
| Serbians | 97.5 /100 | #66 | Exceptional 10.2% |
| Immigrants | Netherlands | 97.3 /100 | #67 | Exceptional 10.2% |
| Immigrants | Sri Lanka | 97.2 /100 | #68 | Exceptional 10.2% |
| Immigrants | Australia | 97.1 /100 | #69 | Exceptional 10.2% |
| Paraguayans | 97.1 /100 | #70 | Exceptional 10.2% |
| Europeans | 97.1 /100 | #71 | Exceptional 10.2% |
Demographics Similar to Panamanians by Male Poverty
In terms of male poverty, the demographic groups most similar to Panamanians are Immigrants from Eastern Africa (12.0%, a difference of 0.35%), Malaysian (12.0%, a difference of 0.45%), Immigrants from Uganda (11.8%, a difference of 0.78%), Immigrants (12.0%, a difference of 0.78%), and Immigrants from the Azores (12.0%, a difference of 0.90%).
| Demographics | Rating | Rank | Male Poverty |
| Iraqis | 14.7 /100 | #198 | Poor 11.7% |
| Spanish | 14.1 /100 | #199 | Poor 11.7% |
| Immigrants | Lebanon | 13.6 /100 | #200 | Poor 11.7% |
| Spaniards | 13.5 /100 | #201 | Poor 11.7% |
| Aleuts | 10.4 /100 | #202 | Poor 11.8% |
| Immigrants | Western Asia | 9.8 /100 | #203 | Tragic 11.8% |
| Immigrants | Uganda | 8.5 /100 | #204 | Tragic 11.8% |
| Panamanians | 6.2 /100 | #205 | Tragic 11.9% |
| Immigrants | Eastern Africa | 5.4 /100 | #206 | Tragic 12.0% |
| Malaysians | 5.2 /100 | #207 | Tragic 12.0% |
| Immigrants | Immigrants | 4.5 /100 | #208 | Tragic 12.0% |
| Immigrants | Azores | 4.3 /100 | #209 | Tragic 12.0% |
| Moroccans | 4.2 /100 | #210 | Tragic 12.0% |
| Immigrants | Panama | 4.0 /100 | #211 | Tragic 12.1% |
| Americans | 3.2 /100 | #212 | Tragic 12.1% |