Swiss vs Immigrants from Cabo Verde Male Poverty
COMPARE
Swiss
Immigrants from Cabo Verde
Male Poverty
Male Poverty Comparison
Swiss
Immigrants from Cabo Verde
10.2%
MALE POVERTY
97.5/ 100
METRIC RATING
64th/ 347
METRIC RANK
13.7%
MALE POVERTY
0.0/ 100
METRIC RATING
282nd/ 347
METRIC RANK
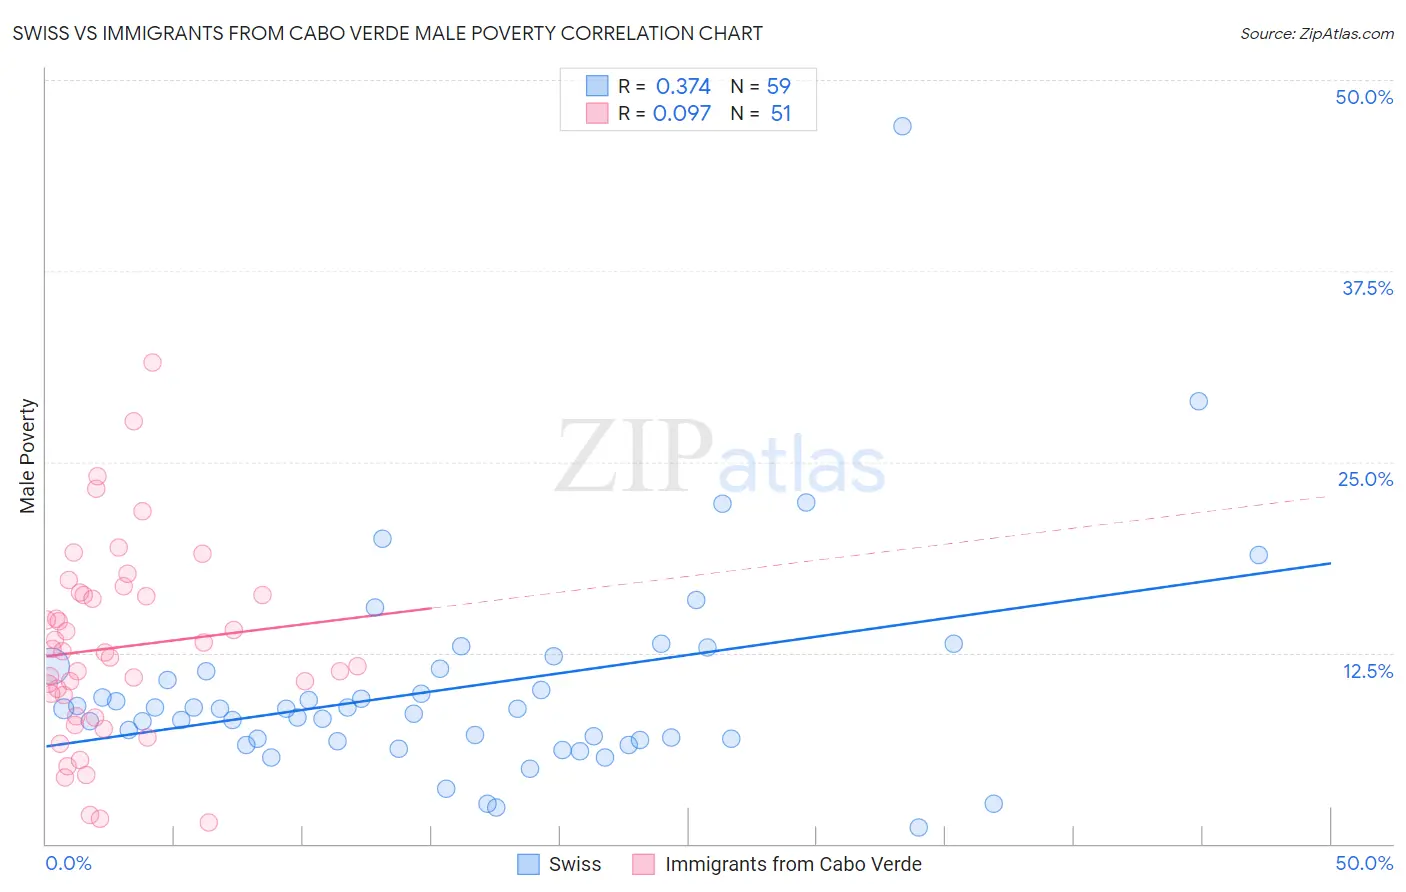
Swiss vs Immigrants from Cabo Verde Male Poverty Correlation Chart
The statistical analysis conducted on geographies consisting of 464,423,995 people shows a mild positive correlation between the proportion of Swiss and poverty level among males in the United States with a correlation coefficient (R) of 0.374 and weighted average of 10.2%. Similarly, the statistical analysis conducted on geographies consisting of 38,133,137 people shows a slight positive correlation between the proportion of Immigrants from Cabo Verde and poverty level among males in the United States with a correlation coefficient (R) of 0.097 and weighted average of 13.7%, a difference of 34.8%.
Male Poverty Correlation Summary
| Measurement | Swiss | Immigrants from Cabo Verde |
| Minimum | 1.1% | 1.4% |
| Maximum | 47.0% | 31.5% |
| Range | 45.9% | 30.1% |
| Mean | 10.2% | 12.8% |
| Median | 8.8% | 12.5% |
| Interquartile 25% (IQ1) | 6.8% | 8.4% |
| Interquartile 75% (IQ3) | 11.4% | 16.3% |
| Interquartile Range (IQR) | 4.7% | 7.9% |
| Standard Deviation (Sample) | 7.0% | 6.3% |
| Standard Deviation (Population) | 6.9% | 6.2% |
Similar Demographics by Male Poverty
Demographics Similar to Swiss by Male Poverty
In terms of male poverty, the demographic groups most similar to Swiss are Zimbabwean (10.2%, a difference of 0.070%), Serbian (10.2%, a difference of 0.080%), Slovak (10.2%, a difference of 0.24%), Immigrants from Netherlands (10.2%, a difference of 0.25%), and Immigrants from Italy (10.2%, a difference of 0.28%).
| Demographics | Rating | Rank | Male Poverty |
| Estonians | 98.1 /100 | #57 | Exceptional 10.1% |
| Scandinavians | 98.0 /100 | #58 | Exceptional 10.1% |
| Immigrants | Europe | 97.9 /100 | #59 | Exceptional 10.1% |
| Ukrainians | 97.9 /100 | #60 | Exceptional 10.1% |
| Austrians | 97.8 /100 | #61 | Exceptional 10.1% |
| Immigrants | Italy | 97.8 /100 | #62 | Exceptional 10.2% |
| Slovaks | 97.7 /100 | #63 | Exceptional 10.2% |
| Swiss | 97.5 /100 | #64 | Exceptional 10.2% |
| Zimbabweans | 97.5 /100 | #65 | Exceptional 10.2% |
| Serbians | 97.5 /100 | #66 | Exceptional 10.2% |
| Immigrants | Netherlands | 97.3 /100 | #67 | Exceptional 10.2% |
| Immigrants | Sri Lanka | 97.2 /100 | #68 | Exceptional 10.2% |
| Immigrants | Australia | 97.1 /100 | #69 | Exceptional 10.2% |
| Paraguayans | 97.1 /100 | #70 | Exceptional 10.2% |
| Europeans | 97.1 /100 | #71 | Exceptional 10.2% |
Demographics Similar to Immigrants from Cabo Verde by Male Poverty
In terms of male poverty, the demographic groups most similar to Immigrants from Cabo Verde are Comanche (13.8%, a difference of 0.20%), Immigrants from Haiti (13.8%, a difference of 0.21%), West Indian (13.8%, a difference of 0.23%), Shoshone (13.8%, a difference of 0.26%), and Yaqui (13.7%, a difference of 0.27%).
| Demographics | Rating | Rank | Male Poverty |
| Barbadians | 0.0 /100 | #275 | Tragic 13.6% |
| Immigrants | Latin America | 0.0 /100 | #276 | Tragic 13.6% |
| Bangladeshis | 0.0 /100 | #277 | Tragic 13.6% |
| Belizeans | 0.0 /100 | #278 | Tragic 13.6% |
| Haitians | 0.0 /100 | #279 | Tragic 13.7% |
| Mexicans | 0.0 /100 | #280 | Tragic 13.7% |
| Yaqui | 0.0 /100 | #281 | Tragic 13.7% |
| Immigrants | Cabo Verde | 0.0 /100 | #282 | Tragic 13.7% |
| Comanche | 0.0 /100 | #283 | Tragic 13.8% |
| Immigrants | Haiti | 0.0 /100 | #284 | Tragic 13.8% |
| West Indians | 0.0 /100 | #285 | Tragic 13.8% |
| Shoshone | 0.0 /100 | #286 | Tragic 13.8% |
| Immigrants | Barbados | 0.0 /100 | #287 | Tragic 13.8% |
| Immigrants | St. Vincent and the Grenadines | 0.0 /100 | #288 | Tragic 13.8% |
| Guatemalans | 0.0 /100 | #289 | Tragic 13.8% |