Swiss vs Immigrants from Cuba Male Poverty
COMPARE
Swiss
Immigrants from Cuba
Male Poverty
Male Poverty Comparison
Swiss
Immigrants from Cuba
10.2%
MALE POVERTY
97.5/ 100
METRIC RATING
64th/ 347
METRIC RANK
12.9%
MALE POVERTY
0.2/ 100
METRIC RATING
251st/ 347
METRIC RANK
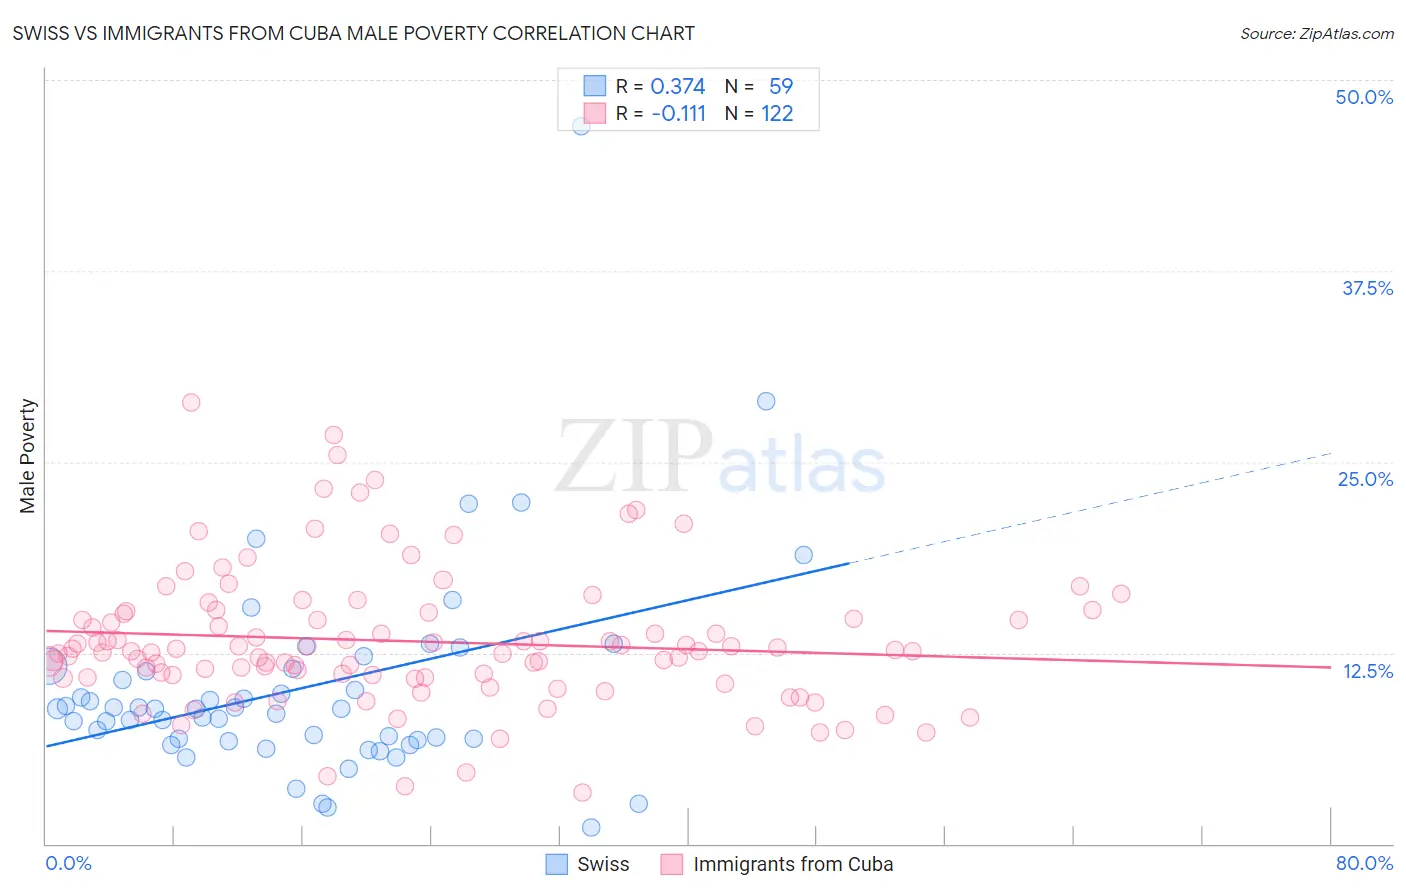
Swiss vs Immigrants from Cuba Male Poverty Correlation Chart
The statistical analysis conducted on geographies consisting of 464,423,995 people shows a mild positive correlation between the proportion of Swiss and poverty level among males in the United States with a correlation coefficient (R) of 0.374 and weighted average of 10.2%. Similarly, the statistical analysis conducted on geographies consisting of 325,880,105 people shows a poor negative correlation between the proportion of Immigrants from Cuba and poverty level among males in the United States with a correlation coefficient (R) of -0.111 and weighted average of 12.9%, a difference of 26.9%.
Male Poverty Correlation Summary
| Measurement | Swiss | Immigrants from Cuba |
| Minimum | 1.1% | 3.3% |
| Maximum | 47.0% | 28.9% |
| Range | 45.9% | 25.5% |
| Mean | 10.2% | 13.2% |
| Median | 8.8% | 12.6% |
| Interquartile 25% (IQ1) | 6.8% | 10.9% |
| Interquartile 75% (IQ3) | 11.4% | 15.1% |
| Interquartile Range (IQR) | 4.7% | 4.2% |
| Standard Deviation (Sample) | 7.0% | 4.5% |
| Standard Deviation (Population) | 6.9% | 4.5% |
Similar Demographics by Male Poverty
Demographics Similar to Swiss by Male Poverty
In terms of male poverty, the demographic groups most similar to Swiss are Zimbabwean (10.2%, a difference of 0.070%), Serbian (10.2%, a difference of 0.080%), Slovak (10.2%, a difference of 0.24%), Immigrants from Netherlands (10.2%, a difference of 0.25%), and Immigrants from Italy (10.2%, a difference of 0.28%).
| Demographics | Rating | Rank | Male Poverty |
| Estonians | 98.1 /100 | #57 | Exceptional 10.1% |
| Scandinavians | 98.0 /100 | #58 | Exceptional 10.1% |
| Immigrants | Europe | 97.9 /100 | #59 | Exceptional 10.1% |
| Ukrainians | 97.9 /100 | #60 | Exceptional 10.1% |
| Austrians | 97.8 /100 | #61 | Exceptional 10.1% |
| Immigrants | Italy | 97.8 /100 | #62 | Exceptional 10.2% |
| Slovaks | 97.7 /100 | #63 | Exceptional 10.2% |
| Swiss | 97.5 /100 | #64 | Exceptional 10.2% |
| Zimbabweans | 97.5 /100 | #65 | Exceptional 10.2% |
| Serbians | 97.5 /100 | #66 | Exceptional 10.2% |
| Immigrants | Netherlands | 97.3 /100 | #67 | Exceptional 10.2% |
| Immigrants | Sri Lanka | 97.2 /100 | #68 | Exceptional 10.2% |
| Immigrants | Australia | 97.1 /100 | #69 | Exceptional 10.2% |
| Paraguayans | 97.1 /100 | #70 | Exceptional 10.2% |
| Europeans | 97.1 /100 | #71 | Exceptional 10.2% |
Demographics Similar to Immigrants from Cuba by Male Poverty
In terms of male poverty, the demographic groups most similar to Immigrants from Cuba are Immigrants from Ecuador (12.9%, a difference of 0.030%), Immigrants from Ghana (12.9%, a difference of 0.080%), Immigrants from Nicaragua (12.9%, a difference of 0.10%), Potawatomi (12.9%, a difference of 0.11%), and Immigrants from Sudan (12.9%, a difference of 0.18%).
| Demographics | Rating | Rank | Male Poverty |
| Tsimshian | 0.3 /100 | #244 | Tragic 12.8% |
| Liberians | 0.3 /100 | #245 | Tragic 12.8% |
| Immigrants | El Salvador | 0.2 /100 | #246 | Tragic 12.8% |
| Immigrants | Western Africa | 0.2 /100 | #247 | Tragic 12.9% |
| Immigrants | Sudan | 0.2 /100 | #248 | Tragic 12.9% |
| Potawatomi | 0.2 /100 | #249 | Tragic 12.9% |
| Immigrants | Nicaragua | 0.2 /100 | #250 | Tragic 12.9% |
| Immigrants | Cuba | 0.2 /100 | #251 | Tragic 12.9% |
| Immigrants | Ecuador | 0.2 /100 | #252 | Tragic 12.9% |
| Immigrants | Ghana | 0.2 /100 | #253 | Tragic 12.9% |
| Mexican American Indians | 0.1 /100 | #254 | Tragic 13.0% |
| Immigrants | Liberia | 0.1 /100 | #255 | Tragic 13.0% |
| Immigrants | Burma/Myanmar | 0.1 /100 | #256 | Tragic 13.0% |
| Immigrants | Trinidad and Tobago | 0.1 /100 | #257 | Tragic 13.1% |
| Cape Verdeans | 0.1 /100 | #258 | Tragic 13.1% |