Tsimshian vs Immigrants from Thailand Seniors Poverty Over the Age of 65
COMPARE
Tsimshian
Immigrants from Thailand
Seniors Poverty Over the Age of 65
Seniors Poverty Over the Age of 65 Comparison
Tsimshian
Immigrants from Thailand
10.8%
SENIORS POVERTY OVER THE AGE OF 65
64.5/ 100
METRIC RATING
163rd/ 347
METRIC RANK
11.0%
SENIORS POVERTY OVER THE AGE OF 65
43.5/ 100
METRIC RATING
180th/ 347
METRIC RANK
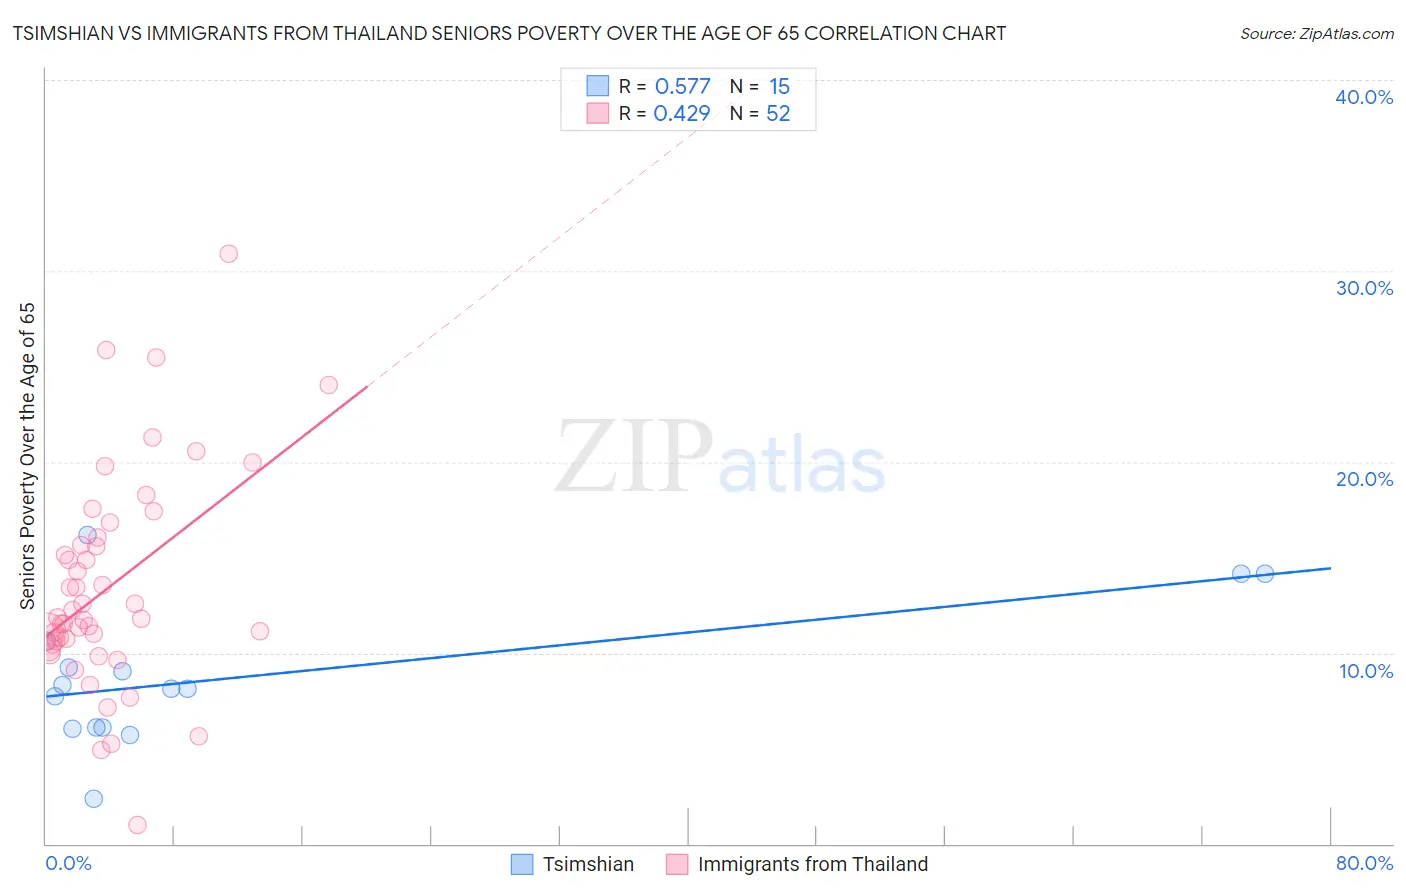
Tsimshian vs Immigrants from Thailand Seniors Poverty Over the Age of 65 Correlation Chart
The statistical analysis conducted on geographies consisting of 15,615,288 people shows a substantial positive correlation between the proportion of Tsimshian and poverty level among seniors over the age of 65 in the United States with a correlation coefficient (R) of 0.577 and weighted average of 10.8%. Similarly, the statistical analysis conducted on geographies consisting of 316,238,604 people shows a moderate positive correlation between the proportion of Immigrants from Thailand and poverty level among seniors over the age of 65 in the United States with a correlation coefficient (R) of 0.429 and weighted average of 11.0%, a difference of 1.9%.
Seniors Poverty Over the Age of 65 Correlation Summary
| Measurement | Tsimshian | Immigrants from Thailand |
| Minimum | 2.3% | 0.97% |
| Maximum | 16.2% | 30.9% |
| Range | 13.8% | 29.9% |
| Mean | 8.8% | 13.4% |
| Median | 8.1% | 11.8% |
| Interquartile 25% (IQ1) | 6.1% | 10.5% |
| Interquartile 75% (IQ3) | 10.6% | 15.8% |
| Interquartile Range (IQR) | 4.5% | 5.3% |
| Standard Deviation (Sample) | 3.7% | 5.6% |
| Standard Deviation (Population) | 3.6% | 5.6% |
Demographics Similar to Tsimshian and Immigrants from Thailand by Seniors Poverty Over the Age of 65
In terms of seniors poverty over the age of 65, the demographic groups most similar to Tsimshian are Immigrants from Indonesia (10.8%, a difference of 0.030%), Arab (10.8%, a difference of 0.070%), Potawatomi (10.8%, a difference of 0.19%), Immigrants from South Eastern Asia (10.8%, a difference of 0.23%), and Malaysian (10.8%, a difference of 0.24%). Similarly, the demographic groups most similar to Immigrants from Thailand are Immigrants from Eastern Africa (11.0%, a difference of 0.0%), Immigrants from Northern Africa (11.0%, a difference of 0.10%), German Russian (11.0%, a difference of 0.31%), Cherokee (11.0%, a difference of 0.35%), and Immigrants from Malaysia (11.0%, a difference of 0.40%).
| Demographics | Rating | Rank | Seniors Poverty Over the Age of 65 |
| Arabs | 65.2 /100 | #161 | Good 10.8% |
| Immigrants | Indonesia | 64.8 /100 | #162 | Good 10.8% |
| Tsimshian | 64.5 /100 | #163 | Good 10.8% |
| Potawatomi | 62.6 /100 | #164 | Good 10.8% |
| Immigrants | South Eastern Asia | 62.1 /100 | #165 | Good 10.8% |
| Malaysians | 62.0 /100 | #166 | Good 10.8% |
| Alaska Natives | 60.3 /100 | #167 | Good 10.8% |
| Mongolians | 58.0 /100 | #168 | Average 10.9% |
| Sri Lankans | 56.8 /100 | #169 | Average 10.9% |
| Immigrants | Eastern Europe | 55.8 /100 | #170 | Average 10.9% |
| Immigrants | Nonimmigrants | 55.1 /100 | #171 | Average 10.9% |
| Immigrants | Syria | 54.7 /100 | #172 | Average 10.9% |
| Spaniards | 50.7 /100 | #173 | Average 10.9% |
| Immigrants | Sudan | 50.0 /100 | #174 | Average 10.9% |
| Creek | 49.6 /100 | #175 | Average 10.9% |
| Immigrants | Malaysia | 47.9 /100 | #176 | Average 11.0% |
| Cherokee | 47.3 /100 | #177 | Average 11.0% |
| German Russians | 46.9 /100 | #178 | Average 11.0% |
| Immigrants | Northern Africa | 44.6 /100 | #179 | Average 11.0% |
| Immigrants | Thailand | 43.5 /100 | #180 | Average 11.0% |
| Immigrants | Eastern Africa | 43.4 /100 | #181 | Average 11.0% |