Swedish vs Immigrants from South Eastern Asia Seniors Poverty Over the Age of 65
COMPARE
Swedish
Immigrants from South Eastern Asia
Seniors Poverty Over the Age of 65
Seniors Poverty Over the Age of 65 Comparison
Swedes
Immigrants from South Eastern Asia
8.7%
SENIORS POVERTY OVER THE AGE OF 65
100.0/ 100
METRIC RATING
4th/ 347
METRIC RANK
10.8%
SENIORS POVERTY OVER THE AGE OF 65
62.1/ 100
METRIC RATING
165th/ 347
METRIC RANK
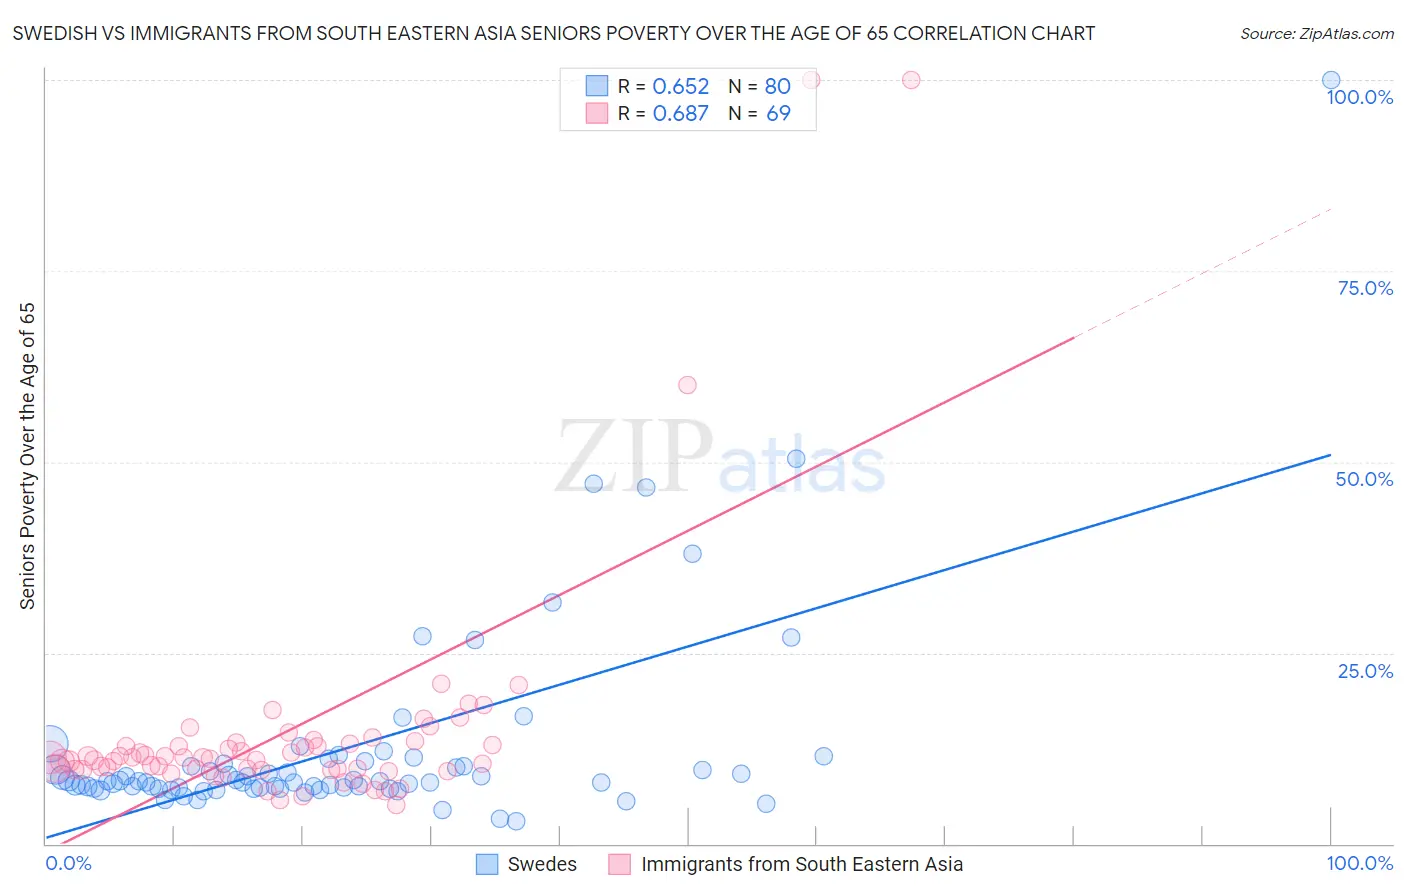
Swedish vs Immigrants from South Eastern Asia Seniors Poverty Over the Age of 65 Correlation Chart
The statistical analysis conducted on geographies consisting of 534,843,881 people shows a significant positive correlation between the proportion of Swedes and poverty level among seniors over the age of 65 in the United States with a correlation coefficient (R) of 0.652 and weighted average of 8.7%. Similarly, the statistical analysis conducted on geographies consisting of 509,715,035 people shows a significant positive correlation between the proportion of Immigrants from South Eastern Asia and poverty level among seniors over the age of 65 in the United States with a correlation coefficient (R) of 0.687 and weighted average of 10.8%, a difference of 23.8%.
Seniors Poverty Over the Age of 65 Correlation Summary
| Measurement | Swedish | Immigrants from South Eastern Asia |
| Minimum | 2.9% | 5.1% |
| Maximum | 100.0% | 100.0% |
| Range | 97.1% | 94.9% |
| Mean | 12.4% | 14.7% |
| Median | 8.2% | 11.2% |
| Interquartile 25% (IQ1) | 7.3% | 9.7% |
| Interquartile 75% (IQ3) | 10.3% | 13.2% |
| Interquartile Range (IQR) | 3.1% | 3.5% |
| Standard Deviation (Sample) | 13.6% | 16.3% |
| Standard Deviation (Population) | 13.5% | 16.2% |
Similar Demographics by Seniors Poverty Over the Age of 65
Demographics Similar to Swedes by Seniors Poverty Over the Age of 65
In terms of seniors poverty over the age of 65, the demographic groups most similar to Swedes are Immigrants from India (8.8%, a difference of 0.36%), Norwegian (8.7%, a difference of 0.60%), Danish (8.8%, a difference of 0.81%), German (9.0%, a difference of 2.4%), and Czech (9.0%, a difference of 3.0%).
| Demographics | Rating | Rank | Seniors Poverty Over the Age of 65 |
| Chinese | 100.0 /100 | #1 | Exceptional 8.3% |
| Tlingit-Haida | 100.0 /100 | #2 | Exceptional 8.3% |
| Norwegians | 100.0 /100 | #3 | Exceptional 8.7% |
| Swedes | 100.0 /100 | #4 | Exceptional 8.7% |
| Immigrants | India | 100.0 /100 | #5 | Exceptional 8.8% |
| Danes | 100.0 /100 | #6 | Exceptional 8.8% |
| Germans | 100.0 /100 | #7 | Exceptional 9.0% |
| Czechs | 100.0 /100 | #8 | Exceptional 9.0% |
| English | 100.0 /100 | #9 | Exceptional 9.1% |
| Lithuanians | 100.0 /100 | #10 | Exceptional 9.1% |
| Maltese | 99.9 /100 | #11 | Exceptional 9.1% |
| Scandinavians | 99.9 /100 | #12 | Exceptional 9.1% |
| Croatians | 99.9 /100 | #13 | Exceptional 9.1% |
| Poles | 99.9 /100 | #14 | Exceptional 9.1% |
| Dutch | 99.9 /100 | #15 | Exceptional 9.1% |
Demographics Similar to Immigrants from South Eastern Asia by Seniors Poverty Over the Age of 65
In terms of seniors poverty over the age of 65, the demographic groups most similar to Immigrants from South Eastern Asia are Malaysian (10.8%, a difference of 0.010%), Potawatomi (10.8%, a difference of 0.050%), Alaska Native (10.8%, a difference of 0.17%), Tsimshian (10.8%, a difference of 0.23%), and Immigrants from Indonesia (10.8%, a difference of 0.27%).
| Demographics | Rating | Rank | Seniors Poverty Over the Age of 65 |
| Immigrants | Sierra Leone | 71.7 /100 | #158 | Good 10.7% |
| Immigrants | Micronesia | 70.8 /100 | #159 | Good 10.7% |
| Sudanese | 68.2 /100 | #160 | Good 10.7% |
| Arabs | 65.2 /100 | #161 | Good 10.8% |
| Immigrants | Indonesia | 64.8 /100 | #162 | Good 10.8% |
| Tsimshian | 64.5 /100 | #163 | Good 10.8% |
| Potawatomi | 62.6 /100 | #164 | Good 10.8% |
| Immigrants | South Eastern Asia | 62.1 /100 | #165 | Good 10.8% |
| Malaysians | 62.0 /100 | #166 | Good 10.8% |
| Alaska Natives | 60.3 /100 | #167 | Good 10.8% |
| Mongolians | 58.0 /100 | #168 | Average 10.9% |
| Sri Lankans | 56.8 /100 | #169 | Average 10.9% |
| Immigrants | Eastern Europe | 55.8 /100 | #170 | Average 10.9% |
| Immigrants | Nonimmigrants | 55.1 /100 | #171 | Average 10.9% |
| Immigrants | Syria | 54.7 /100 | #172 | Average 10.9% |