Swedish vs Arapaho Single Male Poverty
COMPARE
Swedish
Arapaho
Single Male Poverty
Single Male Poverty Comparison
Swedes
Arapaho
13.1%
SINGLE MALE POVERTY
16.8/ 100
METRIC RATING
211th/ 347
METRIC RANK
21.9%
SINGLE MALE POVERTY
0.0/ 100
METRIC RATING
339th/ 347
METRIC RANK
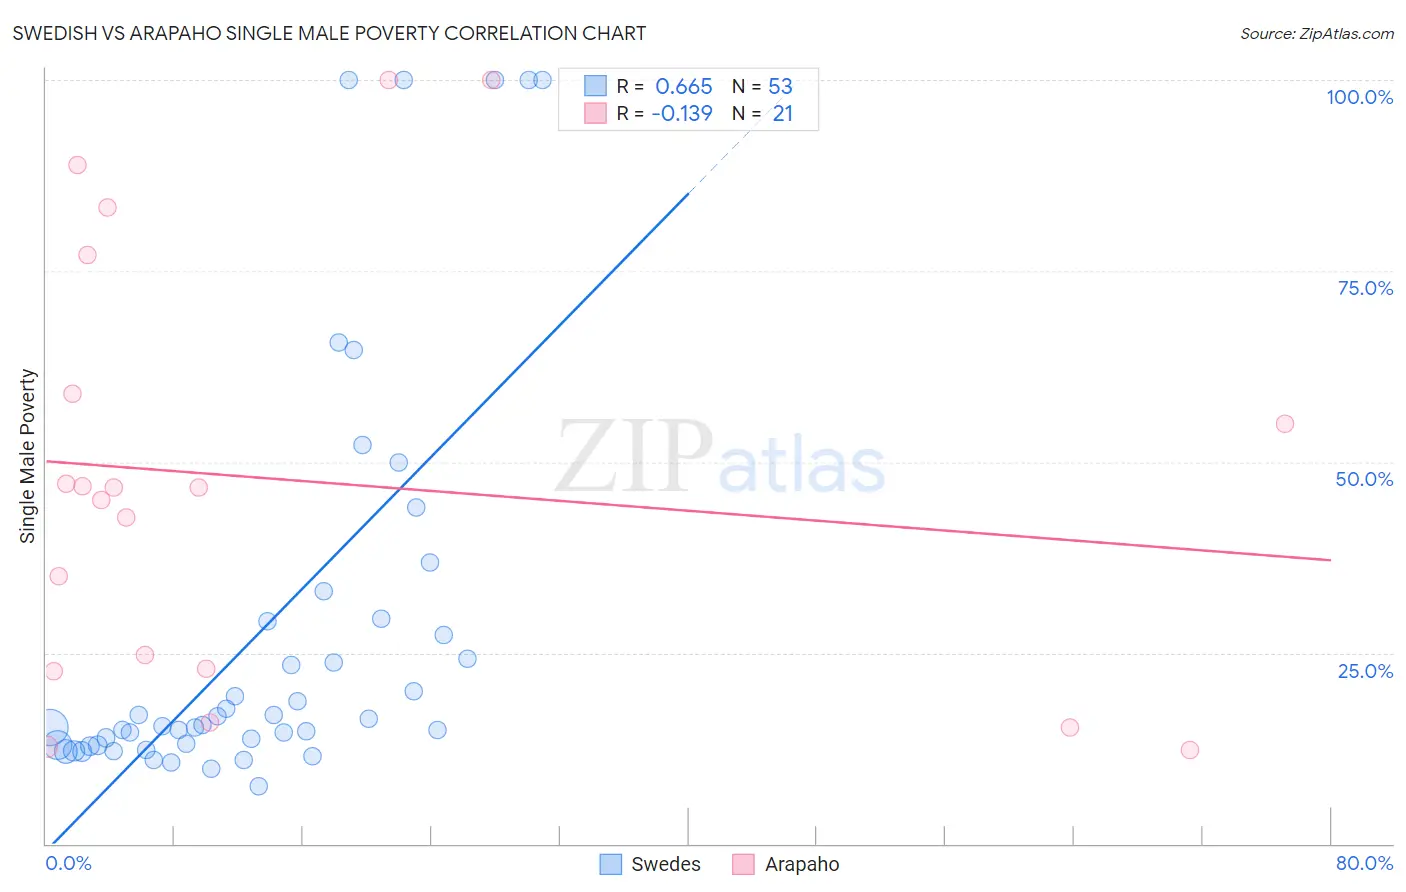
Swedish vs Arapaho Single Male Poverty Correlation Chart
The statistical analysis conducted on geographies consisting of 449,246,015 people shows a significant positive correlation between the proportion of Swedes and poverty level among single males in the United States with a correlation coefficient (R) of 0.665 and weighted average of 13.1%. Similarly, the statistical analysis conducted on geographies consisting of 29,002,421 people shows a poor negative correlation between the proportion of Arapaho and poverty level among single males in the United States with a correlation coefficient (R) of -0.139 and weighted average of 21.9%, a difference of 67.9%.
Single Male Poverty Correlation Summary
| Measurement | Swedish | Arapaho |
| Minimum | 7.6% | 12.3% |
| Maximum | 100.0% | 100.0% |
| Range | 92.4% | 87.7% |
| Mean | 28.3% | 47.6% |
| Median | 15.6% | 46.6% |
| Interquartile 25% (IQ1) | 12.9% | 22.7% |
| Interquartile 75% (IQ3) | 29.3% | 68.0% |
| Interquartile Range (IQR) | 16.4% | 45.3% |
| Standard Deviation (Sample) | 26.7% | 28.3% |
| Standard Deviation (Population) | 26.5% | 27.6% |
Similar Demographics by Single Male Poverty
Demographics Similar to Swedes by Single Male Poverty
In terms of single male poverty, the demographic groups most similar to Swedes are Immigrants from Haiti (13.1%, a difference of 0.010%), Senegalese (13.1%, a difference of 0.030%), Mexican American Indian (13.1%, a difference of 0.060%), Sudanese (13.1%, a difference of 0.080%), and Immigrants from Western Africa (13.1%, a difference of 0.080%).
| Demographics | Rating | Rank | Single Male Poverty |
| Estonians | 20.3 /100 | #204 | Fair 13.0% |
| Poles | 19.3 /100 | #205 | Poor 13.0% |
| Northern Europeans | 18.9 /100 | #206 | Poor 13.0% |
| Sudanese | 17.7 /100 | #207 | Poor 13.1% |
| Immigrants | Western Africa | 17.6 /100 | #208 | Poor 13.1% |
| Mexican American Indians | 17.5 /100 | #209 | Poor 13.1% |
| Immigrants | Haiti | 16.8 /100 | #210 | Poor 13.1% |
| Swedes | 16.8 /100 | #211 | Poor 13.1% |
| Senegalese | 16.4 /100 | #212 | Poor 13.1% |
| Italians | 15.9 /100 | #213 | Poor 13.1% |
| Zimbabweans | 14.9 /100 | #214 | Poor 13.1% |
| Japanese | 14.8 /100 | #215 | Poor 13.1% |
| Austrians | 13.9 /100 | #216 | Poor 13.1% |
| Bermudans | 13.0 /100 | #217 | Poor 13.1% |
| Scandinavians | 12.9 /100 | #218 | Poor 13.1% |
Demographics Similar to Arapaho by Single Male Poverty
In terms of single male poverty, the demographic groups most similar to Arapaho are Sioux (22.2%, a difference of 1.3%), Pueblo (21.6%, a difference of 1.5%), Apache (21.6%, a difference of 1.7%), Tohono O'odham (21.6%, a difference of 1.8%), and Yuman (21.3%, a difference of 3.0%).
| Demographics | Rating | Rank | Single Male Poverty |
| Natives/Alaskans | 0.0 /100 | #332 | Tragic 19.6% |
| Inupiat | 0.0 /100 | #333 | Tragic 20.0% |
| Pima | 0.0 /100 | #334 | Tragic 20.2% |
| Yuman | 0.0 /100 | #335 | Tragic 21.3% |
| Tohono O'odham | 0.0 /100 | #336 | Tragic 21.6% |
| Apache | 0.0 /100 | #337 | Tragic 21.6% |
| Pueblo | 0.0 /100 | #338 | Tragic 21.6% |
| Arapaho | 0.0 /100 | #339 | Tragic 21.9% |
| Sioux | 0.0 /100 | #340 | Tragic 22.2% |
| Crow | 0.0 /100 | #341 | Tragic 23.3% |
| Houma | 0.0 /100 | #342 | Tragic 23.5% |
| Puerto Ricans | 0.0 /100 | #343 | Tragic 25.1% |
| Lumbee | 0.0 /100 | #344 | Tragic 25.2% |
| Navajo | 0.0 /100 | #345 | Tragic 25.3% |
| Hopi | 0.0 /100 | #346 | Tragic 27.5% |