Immigrants from Belarus vs Arapaho Single Male Poverty
COMPARE
Immigrants from Belarus
Arapaho
Single Male Poverty
Single Male Poverty Comparison
Immigrants from Belarus
Arapaho
11.8%
SINGLE MALE POVERTY
99.7/ 100
METRIC RATING
63rd/ 347
METRIC RANK
21.9%
SINGLE MALE POVERTY
0.0/ 100
METRIC RATING
339th/ 347
METRIC RANK
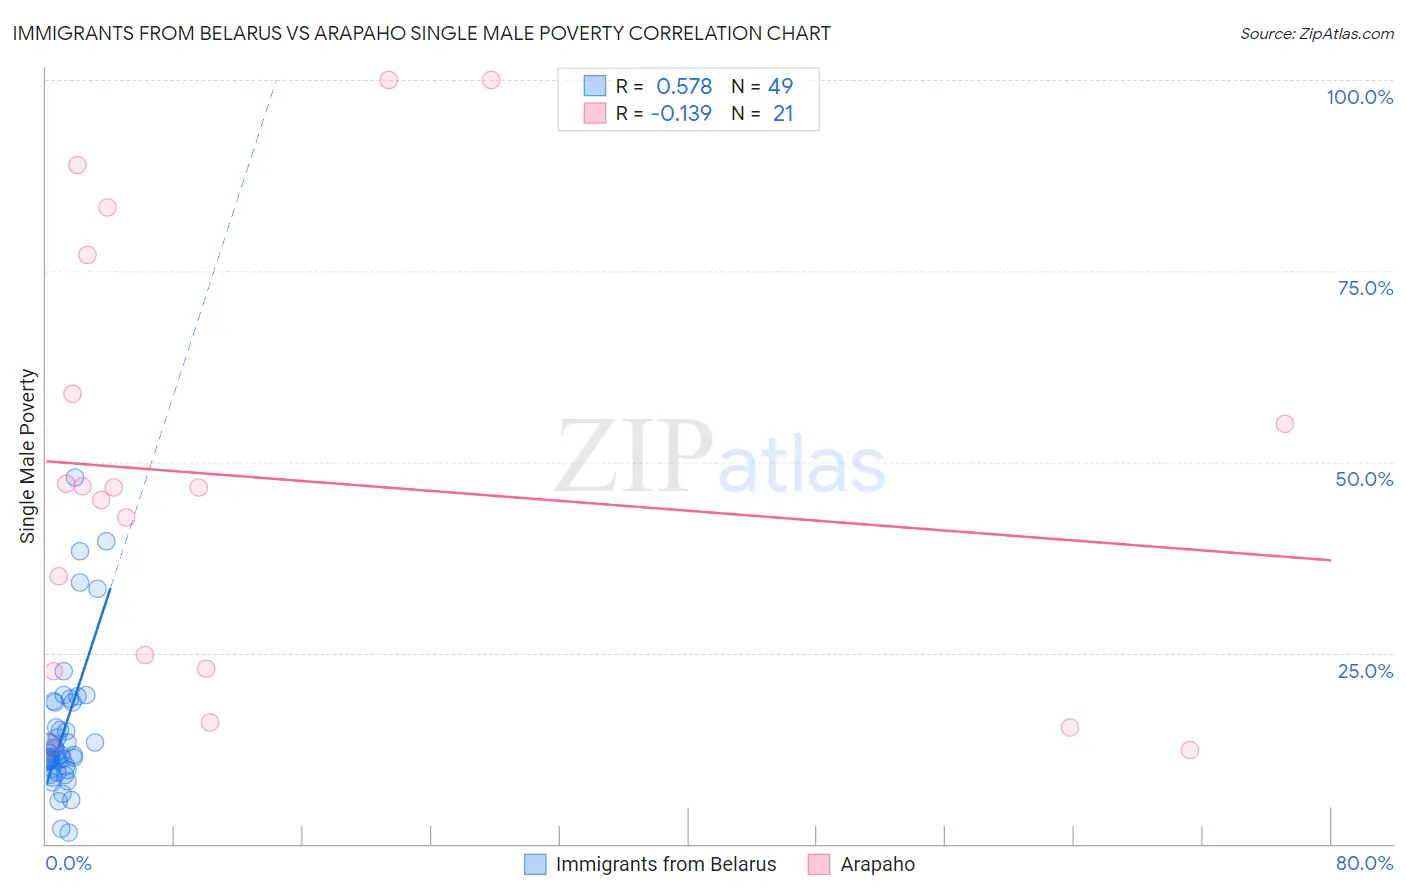
Immigrants from Belarus vs Arapaho Single Male Poverty Correlation Chart
The statistical analysis conducted on geographies consisting of 138,467,710 people shows a substantial positive correlation between the proportion of Immigrants from Belarus and poverty level among single males in the United States with a correlation coefficient (R) of 0.578 and weighted average of 11.8%. Similarly, the statistical analysis conducted on geographies consisting of 29,002,421 people shows a poor negative correlation between the proportion of Arapaho and poverty level among single males in the United States with a correlation coefficient (R) of -0.139 and weighted average of 21.9%, a difference of 85.4%.
Single Male Poverty Correlation Summary
| Measurement | Immigrants from Belarus | Arapaho |
| Minimum | 1.5% | 12.3% |
| Maximum | 48.0% | 100.0% |
| Range | 46.5% | 87.7% |
| Mean | 14.7% | 47.6% |
| Median | 11.6% | 46.6% |
| Interquartile 25% (IQ1) | 9.8% | 22.7% |
| Interquartile 75% (IQ3) | 18.5% | 68.0% |
| Interquartile Range (IQR) | 8.8% | 45.3% |
| Standard Deviation (Sample) | 9.4% | 28.3% |
| Standard Deviation (Population) | 9.3% | 27.6% |
Similar Demographics by Single Male Poverty
Demographics Similar to Immigrants from Belarus by Single Male Poverty
In terms of single male poverty, the demographic groups most similar to Immigrants from Belarus are Immigrants from Sri Lanka (11.8%, a difference of 0.050%), Immigrants from Eastern Europe (11.8%, a difference of 0.14%), Laotian (11.9%, a difference of 0.23%), Immigrants from Uruguay (11.9%, a difference of 0.23%), and Immigrants from Ukraine (11.9%, a difference of 0.25%).
| Demographics | Rating | Rank | Single Male Poverty |
| Burmese | 99.8 /100 | #56 | Exceptional 11.7% |
| Immigrants | Romania | 99.8 /100 | #57 | Exceptional 11.7% |
| Immigrants | Brazil | 99.8 /100 | #58 | Exceptional 11.7% |
| Brazilians | 99.8 /100 | #59 | Exceptional 11.8% |
| Peruvians | 99.8 /100 | #60 | Exceptional 11.8% |
| Cambodians | 99.8 /100 | #61 | Exceptional 11.8% |
| Immigrants | Sri Lanka | 99.7 /100 | #62 | Exceptional 11.8% |
| Immigrants | Belarus | 99.7 /100 | #63 | Exceptional 11.8% |
| Immigrants | Eastern Europe | 99.6 /100 | #64 | Exceptional 11.8% |
| Laotians | 99.6 /100 | #65 | Exceptional 11.9% |
| Immigrants | Uruguay | 99.6 /100 | #66 | Exceptional 11.9% |
| Immigrants | Ukraine | 99.6 /100 | #67 | Exceptional 11.9% |
| Immigrants | Croatia | 99.6 /100 | #68 | Exceptional 11.9% |
| Immigrants | Russia | 99.6 /100 | #69 | Exceptional 11.9% |
| Immigrants | Nepal | 99.6 /100 | #70 | Exceptional 11.9% |
Demographics Similar to Arapaho by Single Male Poverty
In terms of single male poverty, the demographic groups most similar to Arapaho are Sioux (22.2%, a difference of 1.3%), Pueblo (21.6%, a difference of 1.5%), Apache (21.6%, a difference of 1.7%), Tohono O'odham (21.6%, a difference of 1.8%), and Yuman (21.3%, a difference of 3.0%).
| Demographics | Rating | Rank | Single Male Poverty |
| Natives/Alaskans | 0.0 /100 | #332 | Tragic 19.6% |
| Inupiat | 0.0 /100 | #333 | Tragic 20.0% |
| Pima | 0.0 /100 | #334 | Tragic 20.2% |
| Yuman | 0.0 /100 | #335 | Tragic 21.3% |
| Tohono O'odham | 0.0 /100 | #336 | Tragic 21.6% |
| Apache | 0.0 /100 | #337 | Tragic 21.6% |
| Pueblo | 0.0 /100 | #338 | Tragic 21.6% |
| Arapaho | 0.0 /100 | #339 | Tragic 21.9% |
| Sioux | 0.0 /100 | #340 | Tragic 22.2% |
| Crow | 0.0 /100 | #341 | Tragic 23.3% |
| Houma | 0.0 /100 | #342 | Tragic 23.5% |
| Puerto Ricans | 0.0 /100 | #343 | Tragic 25.1% |
| Lumbee | 0.0 /100 | #344 | Tragic 25.2% |
| Navajo | 0.0 /100 | #345 | Tragic 25.3% |
| Hopi | 0.0 /100 | #346 | Tragic 27.5% |