Arab vs Arapaho Single Male Poverty
COMPARE
Arab
Arapaho
Single Male Poverty
Single Male Poverty Comparison
Arabs
Arapaho
13.0%
SINGLE MALE POVERTY
27.0/ 100
METRIC RATING
190th/ 347
METRIC RANK
21.9%
SINGLE MALE POVERTY
0.0/ 100
METRIC RATING
339th/ 347
METRIC RANK
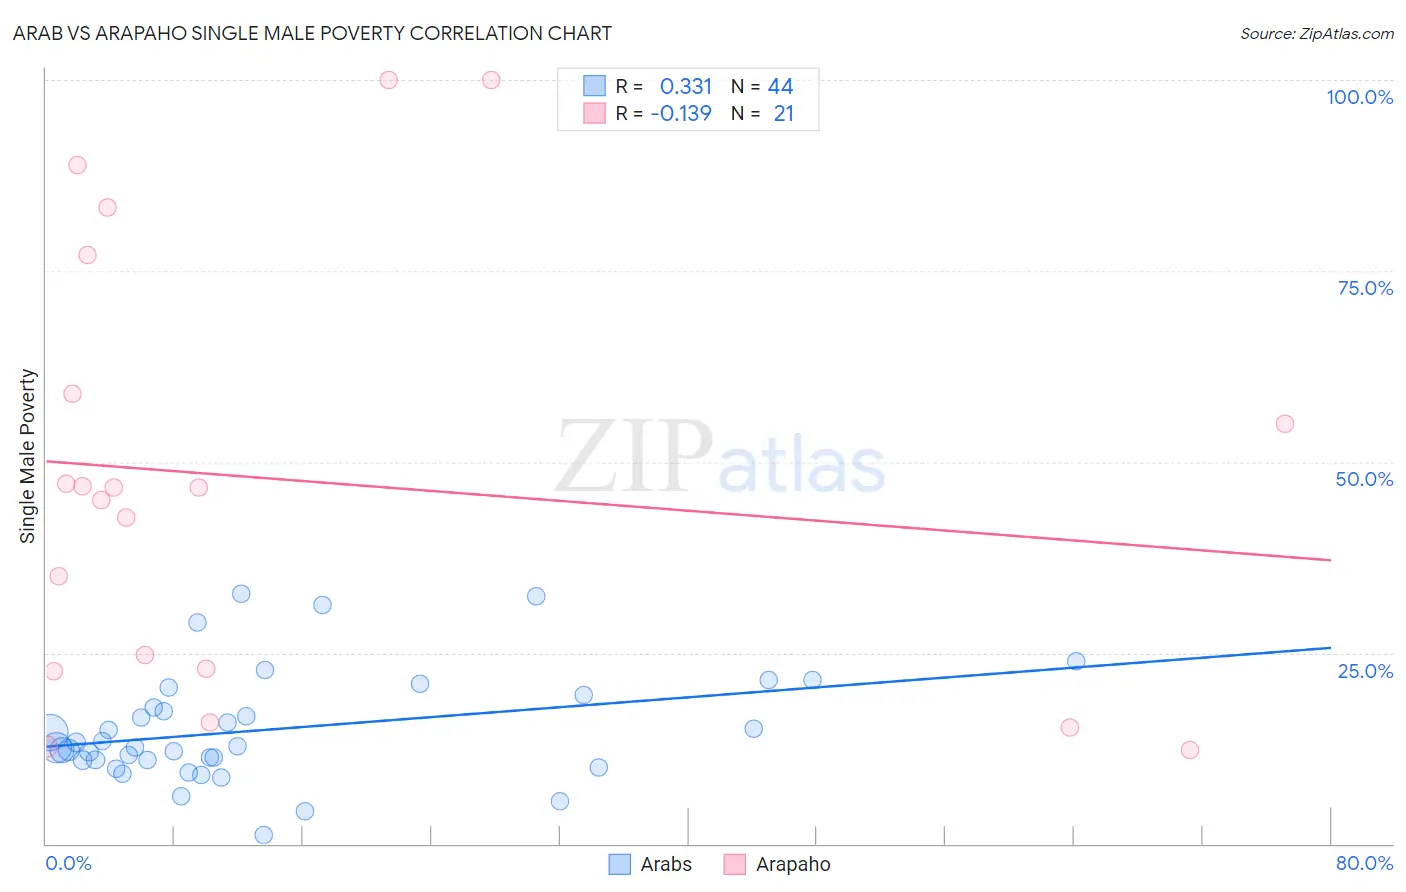
Arab vs Arapaho Single Male Poverty Correlation Chart
The statistical analysis conducted on geographies consisting of 420,354,980 people shows a mild positive correlation between the proportion of Arabs and poverty level among single males in the United States with a correlation coefficient (R) of 0.331 and weighted average of 13.0%. Similarly, the statistical analysis conducted on geographies consisting of 29,002,421 people shows a poor negative correlation between the proportion of Arapaho and poverty level among single males in the United States with a correlation coefficient (R) of -0.139 and weighted average of 21.9%, a difference of 69.2%.
Single Male Poverty Correlation Summary
| Measurement | Arab | Arapaho |
| Minimum | 1.2% | 12.3% |
| Maximum | 32.8% | 100.0% |
| Range | 31.6% | 87.7% |
| Mean | 15.0% | 47.6% |
| Median | 12.7% | 46.6% |
| Interquartile 25% (IQ1) | 11.0% | 22.7% |
| Interquartile 75% (IQ3) | 18.7% | 68.0% |
| Interquartile Range (IQR) | 7.7% | 45.3% |
| Standard Deviation (Sample) | 7.2% | 28.3% |
| Standard Deviation (Population) | 7.1% | 27.6% |
Similar Demographics by Single Male Poverty
Demographics Similar to Arabs by Single Male Poverty
In terms of single male poverty, the demographic groups most similar to Arabs are Immigrants from Thailand (13.0%, a difference of 0.030%), Immigrants from Jamaica (13.0%, a difference of 0.040%), Immigrants from South Africa (13.0%, a difference of 0.060%), Liberian (13.0%, a difference of 0.12%), and Portuguese (12.9%, a difference of 0.21%).
| Demographics | Rating | Rank | Single Male Poverty |
| Immigrants | West Indies | 33.0 /100 | #183 | Fair 12.9% |
| Immigrants | Trinidad and Tobago | 32.5 /100 | #184 | Fair 12.9% |
| Norwegians | 32.0 /100 | #185 | Fair 12.9% |
| Nigerians | 31.9 /100 | #186 | Fair 12.9% |
| Immigrants | Kuwait | 31.9 /100 | #187 | Fair 12.9% |
| Macedonians | 31.5 /100 | #188 | Fair 12.9% |
| Portuguese | 30.2 /100 | #189 | Fair 12.9% |
| Arabs | 27.0 /100 | #190 | Fair 13.0% |
| Immigrants | Thailand | 26.6 /100 | #191 | Fair 13.0% |
| Immigrants | Jamaica | 26.5 /100 | #192 | Fair 13.0% |
| Immigrants | South Africa | 26.1 /100 | #193 | Fair 13.0% |
| Liberians | 25.2 /100 | #194 | Fair 13.0% |
| Immigrants | England | 23.4 /100 | #195 | Fair 13.0% |
| Immigrants | Grenada | 23.1 /100 | #196 | Fair 13.0% |
| Immigrants | Laos | 23.1 /100 | #197 | Fair 13.0% |
Demographics Similar to Arapaho by Single Male Poverty
In terms of single male poverty, the demographic groups most similar to Arapaho are Sioux (22.2%, a difference of 1.3%), Pueblo (21.6%, a difference of 1.5%), Apache (21.6%, a difference of 1.7%), Tohono O'odham (21.6%, a difference of 1.8%), and Yuman (21.3%, a difference of 3.0%).
| Demographics | Rating | Rank | Single Male Poverty |
| Natives/Alaskans | 0.0 /100 | #332 | Tragic 19.6% |
| Inupiat | 0.0 /100 | #333 | Tragic 20.0% |
| Pima | 0.0 /100 | #334 | Tragic 20.2% |
| Yuman | 0.0 /100 | #335 | Tragic 21.3% |
| Tohono O'odham | 0.0 /100 | #336 | Tragic 21.6% |
| Apache | 0.0 /100 | #337 | Tragic 21.6% |
| Pueblo | 0.0 /100 | #338 | Tragic 21.6% |
| Arapaho | 0.0 /100 | #339 | Tragic 21.9% |
| Sioux | 0.0 /100 | #340 | Tragic 22.2% |
| Crow | 0.0 /100 | #341 | Tragic 23.3% |
| Houma | 0.0 /100 | #342 | Tragic 23.5% |
| Puerto Ricans | 0.0 /100 | #343 | Tragic 25.1% |
| Lumbee | 0.0 /100 | #344 | Tragic 25.2% |
| Navajo | 0.0 /100 | #345 | Tragic 25.3% |
| Hopi | 0.0 /100 | #346 | Tragic 27.5% |