Sudanese vs Trinidadian and Tobagonian Seniors Poverty Over the Age of 65
COMPARE
Sudanese
Trinidadian and Tobagonian
Seniors Poverty Over the Age of 65
Seniors Poverty Over the Age of 65 Comparison
Sudanese
Trinidadians and Tobagonians
10.7%
SENIORS POVERTY OVER THE AGE OF 65
68.2/ 100
METRIC RATING
160th/ 347
METRIC RANK
14.2%
SENIORS POVERTY OVER THE AGE OF 65
0.0/ 100
METRIC RATING
308th/ 347
METRIC RANK
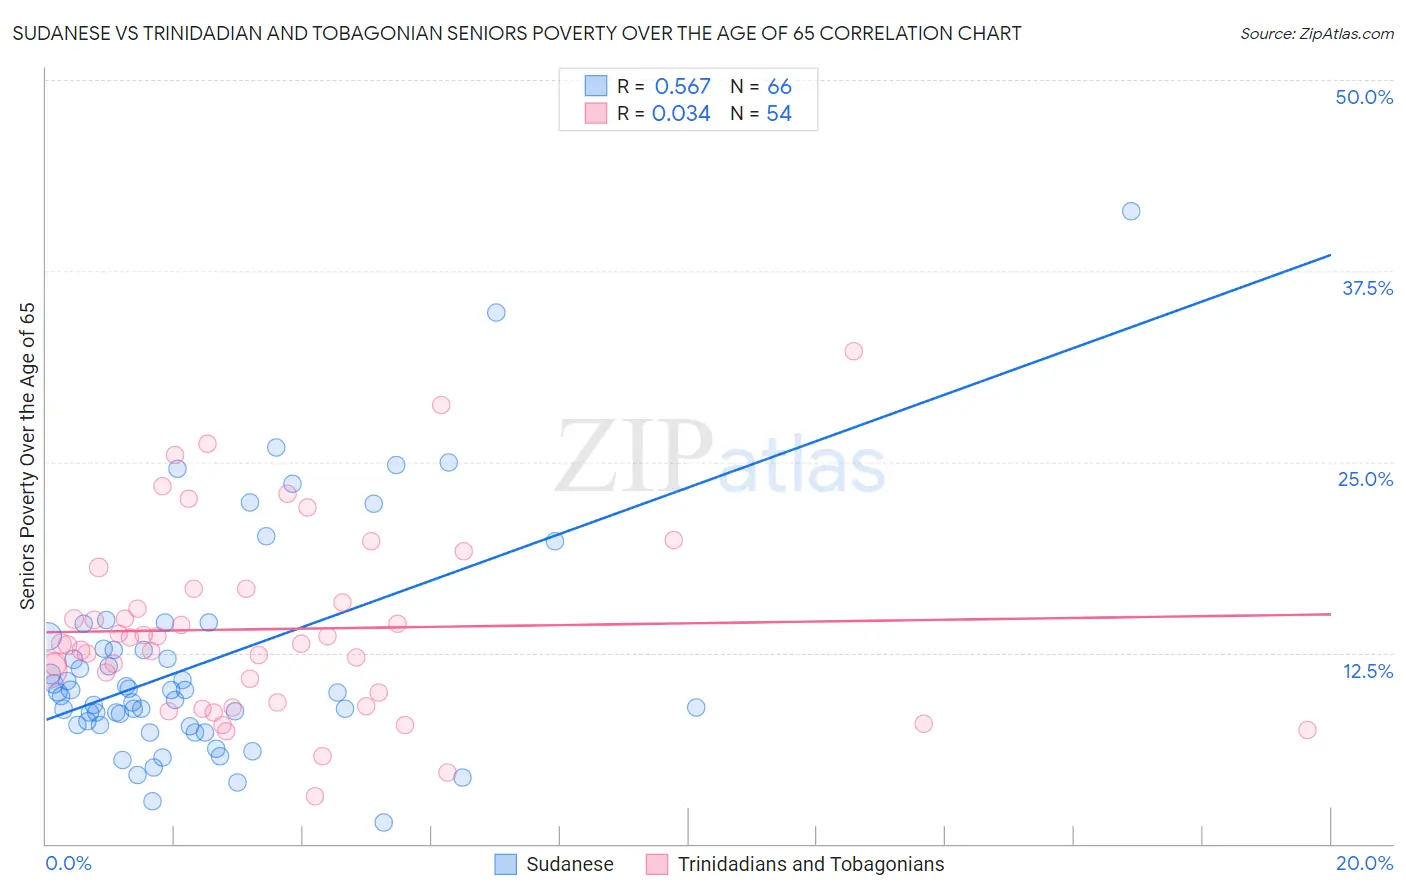
Sudanese vs Trinidadian and Tobagonian Seniors Poverty Over the Age of 65 Correlation Chart
The statistical analysis conducted on geographies consisting of 109,984,274 people shows a substantial positive correlation between the proportion of Sudanese and poverty level among seniors over the age of 65 in the United States with a correlation coefficient (R) of 0.567 and weighted average of 10.7%. Similarly, the statistical analysis conducted on geographies consisting of 219,204,036 people shows no correlation between the proportion of Trinidadians and Tobagonians and poverty level among seniors over the age of 65 in the United States with a correlation coefficient (R) of 0.034 and weighted average of 14.2%, a difference of 32.0%.
Seniors Poverty Over the Age of 65 Correlation Summary
| Measurement | Sudanese | Trinidadian and Tobagonian |
| Minimum | 1.4% | 3.1% |
| Maximum | 41.4% | 32.3% |
| Range | 40.0% | 29.1% |
| Mean | 11.9% | 14.1% |
| Median | 9.9% | 13.1% |
| Interquartile 25% (IQ1) | 7.8% | 9.2% |
| Interquartile 75% (IQ3) | 12.7% | 16.7% |
| Interquartile Range (IQR) | 4.9% | 7.4% |
| Standard Deviation (Sample) | 7.3% | 6.1% |
| Standard Deviation (Population) | 7.3% | 6.0% |
Similar Demographics by Seniors Poverty Over the Age of 65
Demographics Similar to Sudanese by Seniors Poverty Over the Age of 65
In terms of seniors poverty over the age of 65, the demographic groups most similar to Sudanese are Immigrants from Micronesia (10.7%, a difference of 0.27%), Arab (10.8%, a difference of 0.31%), Immigrants from Indonesia (10.8%, a difference of 0.35%), Immigrants from Sierra Leone (10.7%, a difference of 0.37%), and Tsimshian (10.8%, a difference of 0.38%).
| Demographics | Rating | Rank | Seniors Poverty Over the Age of 65 |
| Fijians | 75.6 /100 | #153 | Good 10.7% |
| Immigrants | Saudi Arabia | 74.9 /100 | #154 | Good 10.7% |
| Chickasaw | 73.6 /100 | #155 | Good 10.7% |
| Ethiopians | 72.9 /100 | #156 | Good 10.7% |
| Immigrants | Ethiopia | 72.9 /100 | #157 | Good 10.7% |
| Immigrants | Sierra Leone | 71.7 /100 | #158 | Good 10.7% |
| Immigrants | Micronesia | 70.8 /100 | #159 | Good 10.7% |
| Sudanese | 68.2 /100 | #160 | Good 10.7% |
| Arabs | 65.2 /100 | #161 | Good 10.8% |
| Immigrants | Indonesia | 64.8 /100 | #162 | Good 10.8% |
| Tsimshian | 64.5 /100 | #163 | Good 10.8% |
| Potawatomi | 62.6 /100 | #164 | Good 10.8% |
| Immigrants | South Eastern Asia | 62.1 /100 | #165 | Good 10.8% |
| Malaysians | 62.0 /100 | #166 | Good 10.8% |
| Alaska Natives | 60.3 /100 | #167 | Good 10.8% |
Demographics Similar to Trinidadians and Tobagonians by Seniors Poverty Over the Age of 65
In terms of seniors poverty over the age of 65, the demographic groups most similar to Trinidadians and Tobagonians are Immigrants from West Indies (14.2%, a difference of 0.070%), Honduran (14.2%, a difference of 0.10%), Immigrants from Latin America (14.2%, a difference of 0.21%), Bahamian (14.2%, a difference of 0.36%), and Native/Alaskan (14.2%, a difference of 0.36%).
| Demographics | Rating | Rank | Seniors Poverty Over the Age of 65 |
| U.S. Virgin Islanders | 0.0 /100 | #301 | Tragic 14.0% |
| Yup'ik | 0.0 /100 | #302 | Tragic 14.1% |
| Immigrants | Bangladesh | 0.0 /100 | #303 | Tragic 14.1% |
| West Indians | 0.0 /100 | #304 | Tragic 14.1% |
| Immigrants | Trinidad and Tobago | 0.0 /100 | #305 | Tragic 14.1% |
| Immigrants | Latin America | 0.0 /100 | #306 | Tragic 14.2% |
| Immigrants | West Indies | 0.0 /100 | #307 | Tragic 14.2% |
| Trinidadians and Tobagonians | 0.0 /100 | #308 | Tragic 14.2% |
| Hondurans | 0.0 /100 | #309 | Tragic 14.2% |
| Bahamians | 0.0 /100 | #310 | Tragic 14.2% |
| Natives/Alaskans | 0.0 /100 | #311 | Tragic 14.2% |
| Hispanics or Latinos | 0.0 /100 | #312 | Tragic 14.3% |
| Barbadians | 0.0 /100 | #313 | Tragic 14.4% |
| Guyanese | 0.0 /100 | #314 | Tragic 14.4% |
| Immigrants | Ecuador | 0.0 /100 | #315 | Tragic 14.4% |