Sudanese vs Trinidadian and Tobagonian Unemployment Among Ages 65 to 74 years
COMPARE
Sudanese
Trinidadian and Tobagonian
Unemployment Among Ages 65 to 74 years
Unemployment Among Ages 65 to 74 years Comparison
Sudanese
Trinidadians and Tobagonians
4.6%
UNEMPLOYMENT AMONG AGES 65 TO 74 YEARS
100.0/ 100
METRIC RATING
5th/ 347
METRIC RANK
5.6%
UNEMPLOYMENT AMONG AGES 65 TO 74 YEARS
0.8/ 100
METRIC RATING
249th/ 347
METRIC RANK
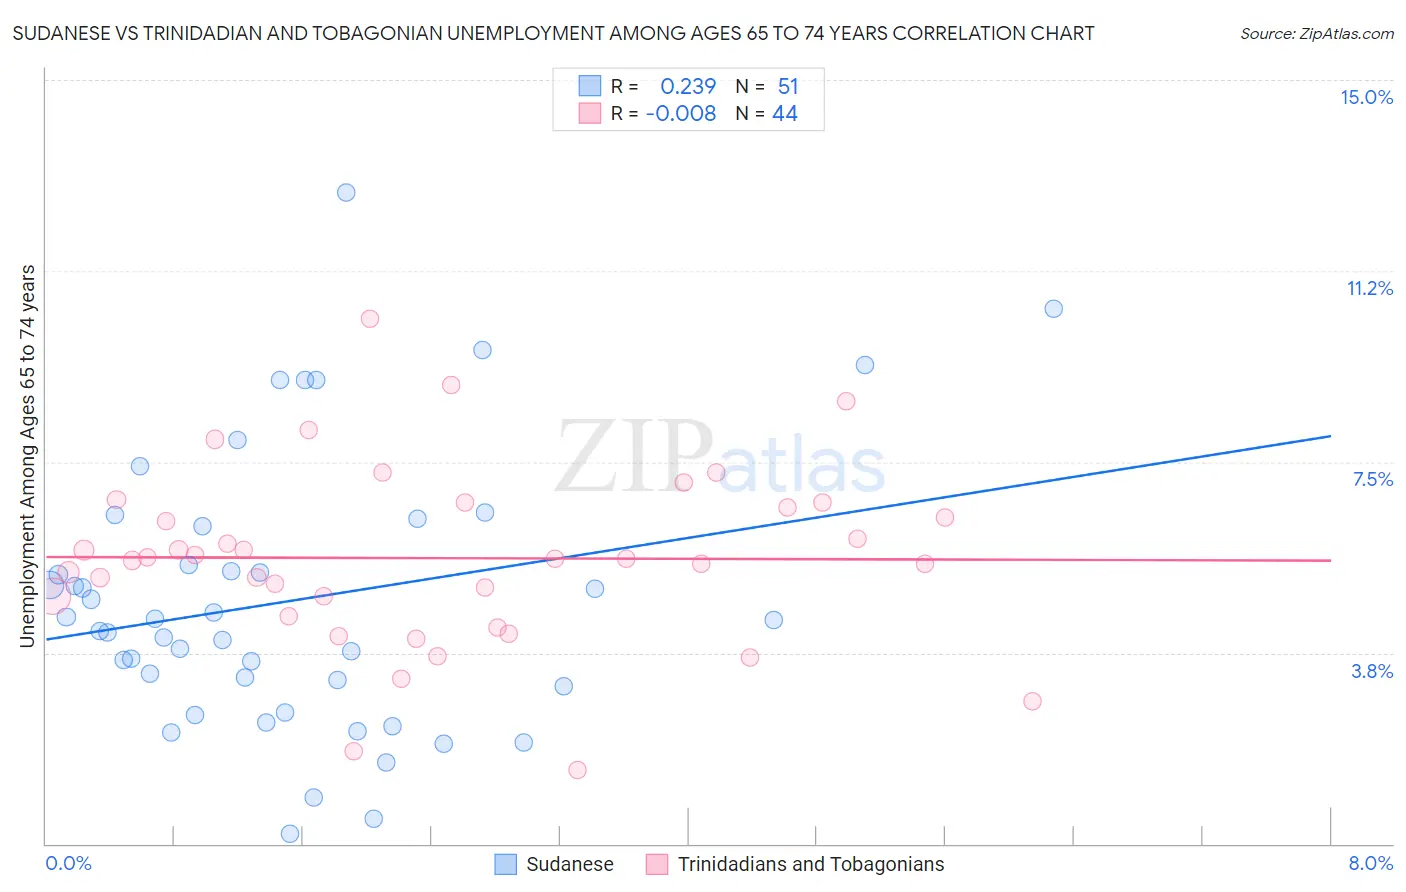
Sudanese vs Trinidadian and Tobagonian Unemployment Among Ages 65 to 74 years Correlation Chart
The statistical analysis conducted on geographies consisting of 104,906,634 people shows a weak positive correlation between the proportion of Sudanese and unemployment rate among population between the ages 65 and 74 in the United States with a correlation coefficient (R) of 0.239 and weighted average of 4.6%. Similarly, the statistical analysis conducted on geographies consisting of 204,784,447 people shows no correlation between the proportion of Trinidadians and Tobagonians and unemployment rate among population between the ages 65 and 74 in the United States with a correlation coefficient (R) of -0.008 and weighted average of 5.6%, a difference of 21.3%.
Unemployment Among Ages 65 to 74 years Correlation Summary
| Measurement | Sudanese | Trinidadian and Tobagonian |
| Minimum | 0.20% | 1.4% |
| Maximum | 12.8% | 10.3% |
| Range | 12.6% | 8.9% |
| Mean | 4.8% | 5.6% |
| Median | 4.4% | 5.6% |
| Interquartile 25% (IQ1) | 3.1% | 4.7% |
| Interquartile 75% (IQ3) | 6.2% | 6.7% |
| Interquartile Range (IQR) | 3.1% | 2.0% |
| Standard Deviation (Sample) | 2.7% | 1.8% |
| Standard Deviation (Population) | 2.7% | 1.7% |
Similar Demographics by Unemployment Among Ages 65 to 74 years
Demographics Similar to Sudanese by Unemployment Among Ages 65 to 74 years
In terms of unemployment among ages 65 to 74 years, the demographic groups most similar to Sudanese are Tsimshian (4.6%, a difference of 0.36%), Immigrants from Cuba (4.6%, a difference of 0.51%), Fijian (4.5%, a difference of 1.9%), Indonesian (4.7%, a difference of 1.9%), and Comanche (4.7%, a difference of 2.1%).
| Demographics | Rating | Rank | Unemployment Among Ages 65 to 74 years |
| Hmong | 100.0 /100 | #1 | Exceptional 4.2% |
| Chinese | 100.0 /100 | #2 | Exceptional 4.4% |
| Fijians | 100.0 /100 | #3 | Exceptional 4.5% |
| Tsimshian | 100.0 /100 | #4 | Exceptional 4.6% |
| Sudanese | 100.0 /100 | #5 | Exceptional 4.6% |
| Immigrants | Cuba | 100.0 /100 | #6 | Exceptional 4.6% |
| Indonesians | 100.0 /100 | #7 | Exceptional 4.7% |
| Comanche | 100.0 /100 | #8 | Exceptional 4.7% |
| Chickasaw | 100.0 /100 | #9 | Exceptional 4.7% |
| Osage | 100.0 /100 | #10 | Exceptional 4.7% |
| Immigrants | Congo | 100.0 /100 | #11 | Exceptional 4.7% |
| Tongans | 100.0 /100 | #12 | Exceptional 4.7% |
| Lumbee | 100.0 /100 | #13 | Exceptional 4.8% |
| Cubans | 100.0 /100 | #14 | Exceptional 4.8% |
| Immigrants | North Macedonia | 100.0 /100 | #15 | Exceptional 4.8% |
Demographics Similar to Trinidadians and Tobagonians by Unemployment Among Ages 65 to 74 years
In terms of unemployment among ages 65 to 74 years, the demographic groups most similar to Trinidadians and Tobagonians are Immigrants (5.6%, a difference of 0.060%), Immigrants from Argentina (5.6%, a difference of 0.060%), Cape Verdean (5.6%, a difference of 0.080%), Immigrants from Greece (5.6%, a difference of 0.12%), and Paraguayan (5.6%, a difference of 0.12%).
| Demographics | Rating | Rank | Unemployment Among Ages 65 to 74 years |
| Immigrants | Ghana | 1.4 /100 | #242 | Tragic 5.6% |
| Immigrants | Peru | 1.3 /100 | #243 | Tragic 5.6% |
| Immigrants | Micronesia | 0.9 /100 | #244 | Tragic 5.6% |
| Immigrants | Greece | 0.9 /100 | #245 | Tragic 5.6% |
| Paraguayans | 0.9 /100 | #246 | Tragic 5.6% |
| Immigrants | Immigrants | 0.9 /100 | #247 | Tragic 5.6% |
| Immigrants | Argentina | 0.9 /100 | #248 | Tragic 5.6% |
| Trinidadians and Tobagonians | 0.8 /100 | #249 | Tragic 5.6% |
| Cape Verdeans | 0.7 /100 | #250 | Tragic 5.6% |
| Brazilians | 0.5 /100 | #251 | Tragic 5.6% |
| Colombians | 0.5 /100 | #252 | Tragic 5.6% |
| Immigrants | Brazil | 0.5 /100 | #253 | Tragic 5.6% |
| Immigrants | Costa Rica | 0.5 /100 | #254 | Tragic 5.6% |
| Immigrants | Haiti | 0.4 /100 | #255 | Tragic 5.6% |
| Native Hawaiians | 0.4 /100 | #256 | Tragic 5.6% |