Italian vs Trinidadian and Tobagonian Seniors Poverty Over the Age of 65
COMPARE
Italian
Trinidadian and Tobagonian
Seniors Poverty Over the Age of 65
Seniors Poverty Over the Age of 65 Comparison
Italians
Trinidadians and Tobagonians
9.3%
SENIORS POVERTY OVER THE AGE OF 65
99.9/ 100
METRIC RATING
27th/ 347
METRIC RANK
14.2%
SENIORS POVERTY OVER THE AGE OF 65
0.0/ 100
METRIC RATING
308th/ 347
METRIC RANK
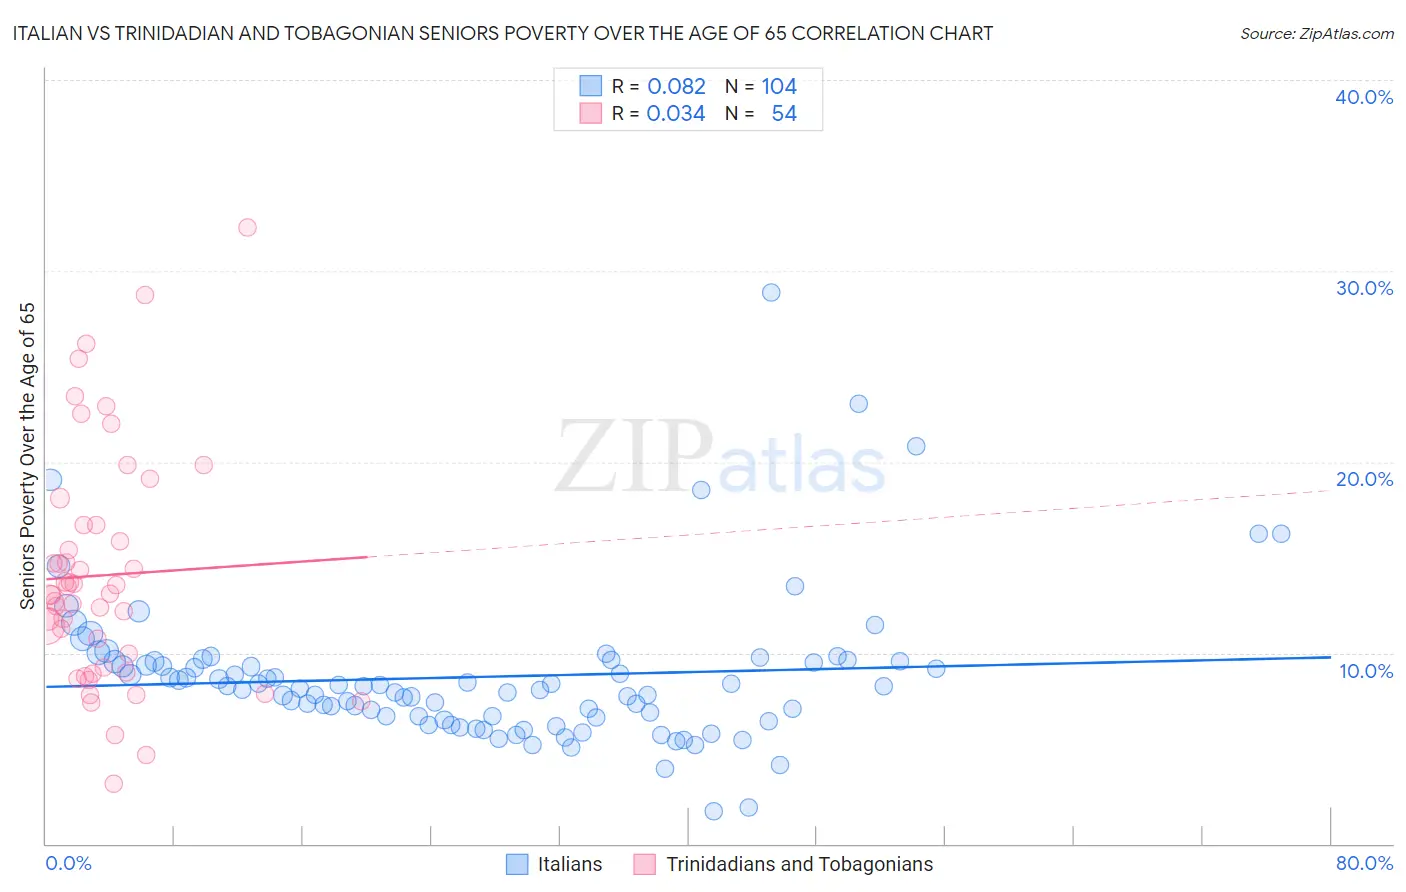
Italian vs Trinidadian and Tobagonian Seniors Poverty Over the Age of 65 Correlation Chart
The statistical analysis conducted on geographies consisting of 569,090,461 people shows a slight positive correlation between the proportion of Italians and poverty level among seniors over the age of 65 in the United States with a correlation coefficient (R) of 0.082 and weighted average of 9.3%. Similarly, the statistical analysis conducted on geographies consisting of 219,204,036 people shows no correlation between the proportion of Trinidadians and Tobagonians and poverty level among seniors over the age of 65 in the United States with a correlation coefficient (R) of 0.034 and weighted average of 14.2%, a difference of 52.6%.
Seniors Poverty Over the Age of 65 Correlation Summary
| Measurement | Italian | Trinidadian and Tobagonian |
| Minimum | 1.7% | 3.1% |
| Maximum | 28.9% | 32.3% |
| Range | 27.2% | 29.1% |
| Mean | 8.7% | 14.1% |
| Median | 8.2% | 13.1% |
| Interquartile 25% (IQ1) | 6.6% | 9.2% |
| Interquartile 75% (IQ3) | 9.5% | 16.7% |
| Interquartile Range (IQR) | 2.9% | 7.4% |
| Standard Deviation (Sample) | 3.9% | 6.1% |
| Standard Deviation (Population) | 3.9% | 6.0% |
Similar Demographics by Seniors Poverty Over the Age of 65
Demographics Similar to Italians by Seniors Poverty Over the Age of 65
In terms of seniors poverty over the age of 65, the demographic groups most similar to Italians are Immigrants from Scotland (9.3%, a difference of 0.080%), Irish (9.3%, a difference of 0.10%), Tongan (9.3%, a difference of 0.20%), Bulgarian (9.3%, a difference of 0.38%), and Welsh (9.3%, a difference of 0.45%).
| Demographics | Rating | Rank | Seniors Poverty Over the Age of 65 |
| Thais | 99.9 /100 | #20 | Exceptional 9.2% |
| Luxembourgers | 99.9 /100 | #21 | Exceptional 9.2% |
| Slovenes | 99.9 /100 | #22 | Exceptional 9.3% |
| Welsh | 99.9 /100 | #23 | Exceptional 9.3% |
| Bulgarians | 99.9 /100 | #24 | Exceptional 9.3% |
| Irish | 99.9 /100 | #25 | Exceptional 9.3% |
| Immigrants | Scotland | 99.9 /100 | #26 | Exceptional 9.3% |
| Italians | 99.9 /100 | #27 | Exceptional 9.3% |
| Tongans | 99.9 /100 | #28 | Exceptional 9.3% |
| Bhutanese | 99.9 /100 | #29 | Exceptional 9.3% |
| Menominee | 99.8 /100 | #30 | Exceptional 9.4% |
| Finns | 99.8 /100 | #31 | Exceptional 9.4% |
| Northern Europeans | 99.8 /100 | #32 | Exceptional 9.4% |
| Native Hawaiians | 99.8 /100 | #33 | Exceptional 9.4% |
| British | 99.8 /100 | #34 | Exceptional 9.4% |
Demographics Similar to Trinidadians and Tobagonians by Seniors Poverty Over the Age of 65
In terms of seniors poverty over the age of 65, the demographic groups most similar to Trinidadians and Tobagonians are Immigrants from West Indies (14.2%, a difference of 0.070%), Honduran (14.2%, a difference of 0.10%), Immigrants from Latin America (14.2%, a difference of 0.21%), Bahamian (14.2%, a difference of 0.36%), and Native/Alaskan (14.2%, a difference of 0.36%).
| Demographics | Rating | Rank | Seniors Poverty Over the Age of 65 |
| U.S. Virgin Islanders | 0.0 /100 | #301 | Tragic 14.0% |
| Yup'ik | 0.0 /100 | #302 | Tragic 14.1% |
| Immigrants | Bangladesh | 0.0 /100 | #303 | Tragic 14.1% |
| West Indians | 0.0 /100 | #304 | Tragic 14.1% |
| Immigrants | Trinidad and Tobago | 0.0 /100 | #305 | Tragic 14.1% |
| Immigrants | Latin America | 0.0 /100 | #306 | Tragic 14.2% |
| Immigrants | West Indies | 0.0 /100 | #307 | Tragic 14.2% |
| Trinidadians and Tobagonians | 0.0 /100 | #308 | Tragic 14.2% |
| Hondurans | 0.0 /100 | #309 | Tragic 14.2% |
| Bahamians | 0.0 /100 | #310 | Tragic 14.2% |
| Natives/Alaskans | 0.0 /100 | #311 | Tragic 14.2% |
| Hispanics or Latinos | 0.0 /100 | #312 | Tragic 14.3% |
| Barbadians | 0.0 /100 | #313 | Tragic 14.4% |
| Guyanese | 0.0 /100 | #314 | Tragic 14.4% |
| Immigrants | Ecuador | 0.0 /100 | #315 | Tragic 14.4% |