Sudanese vs Immigrants from Peru In Labor Force | Age 20-64
COMPARE
Sudanese
Immigrants from Peru
In Labor Force | Age 20-64
In Labor Force | Age 20-64 Comparison
Sudanese
Immigrants from Peru
80.8%
IN LABOR FORCE | AGE 20-64
100.0/ 100
METRIC RATING
22nd/ 347
METRIC RANK
80.3%
IN LABOR FORCE | AGE 20-64
99.2/ 100
METRIC RATING
53rd/ 347
METRIC RANK
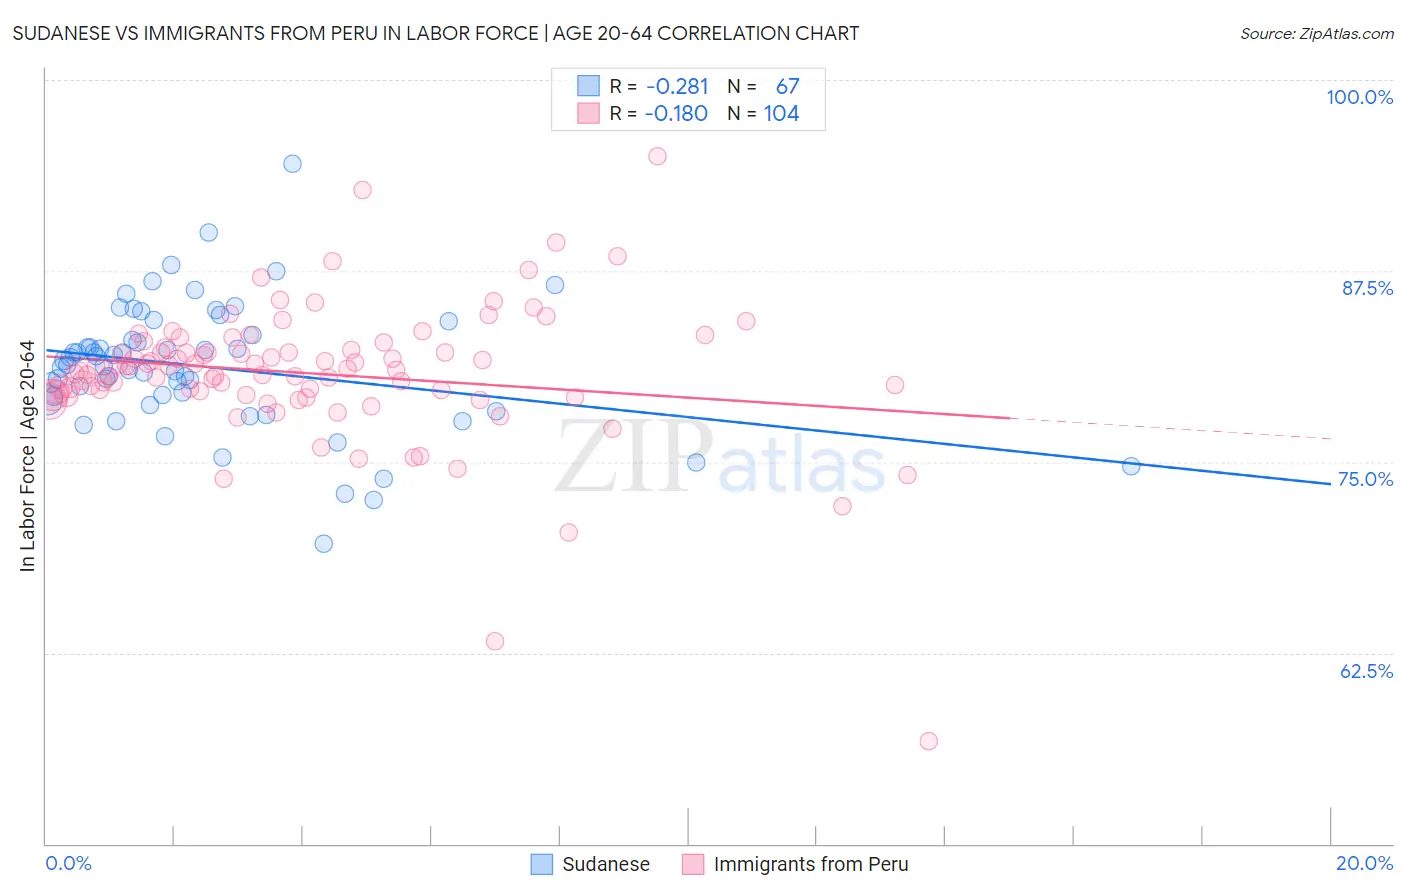
Sudanese vs Immigrants from Peru In Labor Force | Age 20-64 Correlation Chart
The statistical analysis conducted on geographies consisting of 110,143,017 people shows a weak negative correlation between the proportion of Sudanese and labor force participation rate among population between the ages 20 and 64 in the United States with a correlation coefficient (R) of -0.281 and weighted average of 80.8%. Similarly, the statistical analysis conducted on geographies consisting of 328,856,487 people shows a poor negative correlation between the proportion of Immigrants from Peru and labor force participation rate among population between the ages 20 and 64 in the United States with a correlation coefficient (R) of -0.180 and weighted average of 80.3%, a difference of 0.64%.
In Labor Force | Age 20-64 Correlation Summary
| Measurement | Sudanese | Immigrants from Peru |
| Minimum | 69.6% | 56.7% |
| Maximum | 94.5% | 95.0% |
| Range | 24.9% | 38.3% |
| Mean | 81.2% | 80.8% |
| Median | 81.4% | 81.0% |
| Interquartile 25% (IQ1) | 79.1% | 79.5% |
| Interquartile 75% (IQ3) | 83.3% | 82.4% |
| Interquartile Range (IQR) | 4.2% | 2.9% |
| Standard Deviation (Sample) | 4.2% | 4.7% |
| Standard Deviation (Population) | 4.2% | 4.7% |
Similar Demographics by In Labor Force | Age 20-64
Demographics Similar to Sudanese by In Labor Force | Age 20-64
In terms of in labor force | age 20-64, the demographic groups most similar to Sudanese are Immigrants from Bosnia and Herzegovina (80.8%, a difference of 0.0%), Immigrants from Morocco (80.8%, a difference of 0.020%), Kenyan (80.8%, a difference of 0.030%), Immigrants from Serbia (80.8%, a difference of 0.050%), and Liberian (80.9%, a difference of 0.070%).
| Demographics | Rating | Rank | In Labor Force | Age 20-64 |
| Bulgarians | 100.0 /100 | #15 | Exceptional 81.1% |
| Immigrants | Nepal | 100.0 /100 | #16 | Exceptional 81.1% |
| Norwegians | 100.0 /100 | #17 | Exceptional 81.0% |
| Immigrants | Bulgaria | 100.0 /100 | #18 | Exceptional 81.0% |
| Zimbabweans | 100.0 /100 | #19 | Exceptional 81.0% |
| Thais | 100.0 /100 | #20 | Exceptional 80.9% |
| Liberians | 100.0 /100 | #21 | Exceptional 80.9% |
| Sudanese | 100.0 /100 | #22 | Exceptional 80.8% |
| Immigrants | Bosnia and Herzegovina | 100.0 /100 | #23 | Exceptional 80.8% |
| Immigrants | Morocco | 100.0 /100 | #24 | Exceptional 80.8% |
| Kenyans | 100.0 /100 | #25 | Exceptional 80.8% |
| Immigrants | Serbia | 100.0 /100 | #26 | Exceptional 80.8% |
| Immigrants | Kenya | 99.9 /100 | #27 | Exceptional 80.7% |
| Immigrants | Uganda | 99.9 /100 | #28 | Exceptional 80.7% |
| Immigrants | South Central Asia | 99.9 /100 | #29 | Exceptional 80.7% |
Demographics Similar to Immigrants from Peru by In Labor Force | Age 20-64
In terms of in labor force | age 20-64, the demographic groups most similar to Immigrants from Peru are Peruvian (80.3%, a difference of 0.010%), Turkish (80.3%, a difference of 0.020%), Immigrants from Sri Lanka (80.4%, a difference of 0.030%), Immigrants from Cabo Verde (80.3%, a difference of 0.040%), and Immigrants from Northern Africa (80.3%, a difference of 0.050%).
| Demographics | Rating | Rank | In Labor Force | Age 20-64 |
| Immigrants | Pakistan | 99.6 /100 | #46 | Exceptional 80.5% |
| Immigrants | Africa | 99.6 /100 | #47 | Exceptional 80.4% |
| Immigrants | Hong Kong | 99.5 /100 | #48 | Exceptional 80.4% |
| Immigrants | Greece | 99.4 /100 | #49 | Exceptional 80.4% |
| Immigrants | Sudan | 99.4 /100 | #50 | Exceptional 80.4% |
| Immigrants | Sri Lanka | 99.3 /100 | #51 | Exceptional 80.4% |
| Turks | 99.2 /100 | #52 | Exceptional 80.3% |
| Immigrants | Peru | 99.2 /100 | #53 | Exceptional 80.3% |
| Peruvians | 99.1 /100 | #54 | Exceptional 80.3% |
| Immigrants | Cabo Verde | 99.0 /100 | #55 | Exceptional 80.3% |
| Immigrants | Northern Africa | 99.0 /100 | #56 | Exceptional 80.3% |
| Afghans | 98.9 /100 | #57 | Exceptional 80.3% |
| Serbians | 98.9 /100 | #58 | Exceptional 80.3% |
| Swedes | 98.9 /100 | #59 | Exceptional 80.3% |
| Tongans | 98.8 /100 | #60 | Exceptional 80.3% |