Immigrants from Serbia vs Spaniard Single Mother Poverty
COMPARE
Immigrants from Serbia
Spaniard
Single Mother Poverty
Single Mother Poverty Comparison
Immigrants from Serbia
Spaniards
26.9%
SINGLE MOTHER POVERTY
99.9/ 100
METRIC RATING
46th/ 347
METRIC RANK
30.2%
SINGLE MOTHER POVERTY
5.4/ 100
METRIC RATING
228th/ 347
METRIC RANK
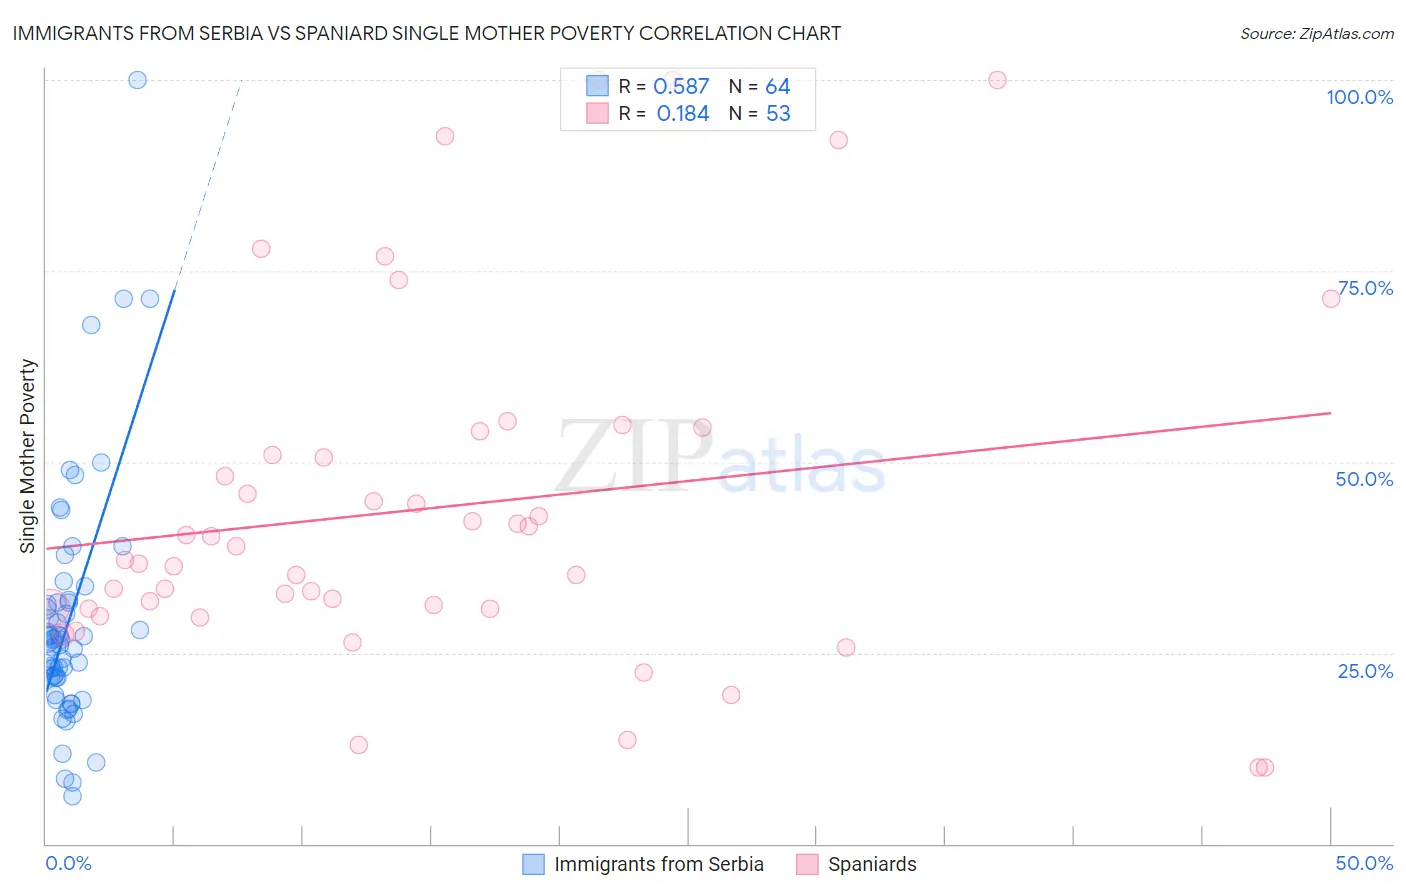
Immigrants from Serbia vs Spaniard Single Mother Poverty Correlation Chart
The statistical analysis conducted on geographies consisting of 130,174,648 people shows a substantial positive correlation between the proportion of Immigrants from Serbia and poverty level among single mothers in the United States with a correlation coefficient (R) of 0.587 and weighted average of 26.9%. Similarly, the statistical analysis conducted on geographies consisting of 431,071,159 people shows a poor positive correlation between the proportion of Spaniards and poverty level among single mothers in the United States with a correlation coefficient (R) of 0.184 and weighted average of 30.2%, a difference of 12.2%.
Single Mother Poverty Correlation Summary
| Measurement | Immigrants from Serbia | Spaniard |
| Minimum | 6.2% | 10.0% |
| Maximum | 100.0% | 100.0% |
| Range | 93.8% | 90.0% |
| Mean | 29.2% | 44.0% |
| Median | 26.4% | 37.1% |
| Interquartile 25% (IQ1) | 21.8% | 30.8% |
| Interquartile 75% (IQ3) | 31.6% | 52.5% |
| Interquartile Range (IQR) | 9.8% | 21.7% |
| Standard Deviation (Sample) | 15.9% | 22.9% |
| Standard Deviation (Population) | 15.8% | 22.7% |
Similar Demographics by Single Mother Poverty
Demographics Similar to Immigrants from Serbia by Single Mother Poverty
In terms of single mother poverty, the demographic groups most similar to Immigrants from Serbia are Latvian (26.9%, a difference of 0.040%), Egyptian (26.9%, a difference of 0.060%), Immigrants from Sierra Leone (26.9%, a difference of 0.12%), Immigrants from Poland (26.9%, a difference of 0.13%), and Cambodian (27.0%, a difference of 0.22%).
| Demographics | Rating | Rank | Single Mother Poverty |
| Sri Lankans | 99.9 /100 | #39 | Exceptional 26.7% |
| Immigrants | Vietnam | 99.9 /100 | #40 | Exceptional 26.7% |
| Immigrants | Greece | 99.9 /100 | #41 | Exceptional 26.7% |
| Armenians | 99.9 /100 | #42 | Exceptional 26.8% |
| Tsimshian | 99.9 /100 | #43 | Exceptional 26.8% |
| Immigrants | Sierra Leone | 99.9 /100 | #44 | Exceptional 26.9% |
| Latvians | 99.9 /100 | #45 | Exceptional 26.9% |
| Immigrants | Serbia | 99.9 /100 | #46 | Exceptional 26.9% |
| Egyptians | 99.8 /100 | #47 | Exceptional 26.9% |
| Immigrants | Poland | 99.8 /100 | #48 | Exceptional 26.9% |
| Cambodians | 99.8 /100 | #49 | Exceptional 27.0% |
| Laotians | 99.8 /100 | #50 | Exceptional 27.0% |
| Immigrants | Argentina | 99.7 /100 | #51 | Exceptional 27.1% |
| Immigrants | South Eastern Asia | 99.7 /100 | #52 | Exceptional 27.1% |
| Immigrants | Jordan | 99.7 /100 | #53 | Exceptional 27.1% |
Demographics Similar to Spaniards by Single Mother Poverty
In terms of single mother poverty, the demographic groups most similar to Spaniards are Immigrants from Barbados (30.2%, a difference of 0.090%), Immigrants from Liberia (30.1%, a difference of 0.11%), English (30.2%, a difference of 0.13%), Scottish (30.1%, a difference of 0.14%), and Spanish (30.1%, a difference of 0.20%).
| Demographics | Rating | Rank | Single Mother Poverty |
| Immigrants | Eritrea | 7.7 /100 | #221 | Tragic 30.0% |
| Sudanese | 7.6 /100 | #222 | Tragic 30.0% |
| Immigrants | Cuba | 6.9 /100 | #223 | Tragic 30.1% |
| Immigrants | Sudan | 6.5 /100 | #224 | Tragic 30.1% |
| Spanish | 6.3 /100 | #225 | Tragic 30.1% |
| Scottish | 6.0 /100 | #226 | Tragic 30.1% |
| Immigrants | Liberia | 5.9 /100 | #227 | Tragic 30.1% |
| Spaniards | 5.4 /100 | #228 | Tragic 30.2% |
| Immigrants | Barbados | 5.0 /100 | #229 | Tragic 30.2% |
| English | 4.8 /100 | #230 | Tragic 30.2% |
| Dutch | 4.3 /100 | #231 | Tragic 30.2% |
| Alaskan Athabascans | 4.1 /100 | #232 | Tragic 30.3% |
| Immigrants | Middle Africa | 3.5 /100 | #233 | Tragic 30.3% |
| Immigrants | Nicaragua | 3.5 /100 | #234 | Tragic 30.3% |
| Immigrants | Grenada | 3.4 /100 | #235 | Tragic 30.3% |