Spanish vs Nigerian Single Mother Poverty
COMPARE
Spanish
Nigerian
Single Mother Poverty
Single Mother Poverty Comparison
Spanish
Nigerians
30.1%
SINGLE MOTHER POVERTY
6.3/ 100
METRIC RATING
225th/ 347
METRIC RANK
29.3%
SINGLE MOTHER POVERTY
38.0/ 100
METRIC RATING
184th/ 347
METRIC RANK
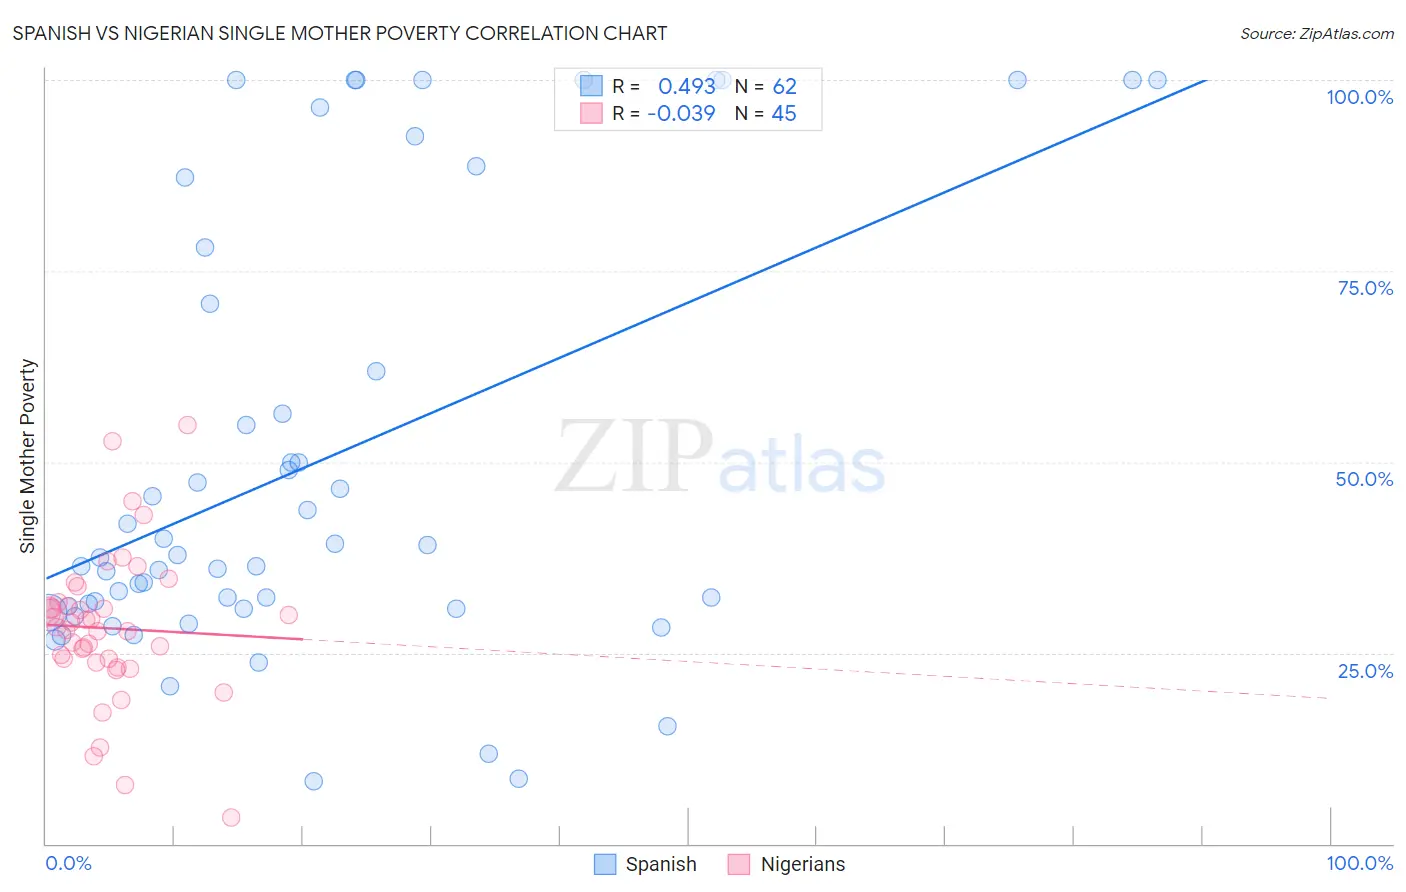
Spanish vs Nigerian Single Mother Poverty Correlation Chart
The statistical analysis conducted on geographies consisting of 411,729,340 people shows a moderate positive correlation between the proportion of Spanish and poverty level among single mothers in the United States with a correlation coefficient (R) of 0.493 and weighted average of 30.1%. Similarly, the statistical analysis conducted on geographies consisting of 328,233,432 people shows no correlation between the proportion of Nigerians and poverty level among single mothers in the United States with a correlation coefficient (R) of -0.039 and weighted average of 29.3%, a difference of 2.6%.
Single Mother Poverty Correlation Summary
| Measurement | Spanish | Nigerian |
| Minimum | 8.1% | 3.4% |
| Maximum | 100.0% | 54.8% |
| Range | 91.9% | 51.3% |
| Mean | 50.1% | 28.2% |
| Median | 37.7% | 28.3% |
| Interquartile 25% (IQ1) | 30.8% | 24.0% |
| Interquartile 75% (IQ3) | 70.7% | 31.3% |
| Interquartile Range (IQR) | 39.9% | 7.4% |
| Standard Deviation (Sample) | 28.6% | 9.8% |
| Standard Deviation (Population) | 28.4% | 9.7% |
Similar Demographics by Single Mother Poverty
Demographics Similar to Spanish by Single Mother Poverty
In terms of single mother poverty, the demographic groups most similar to Spanish are Immigrants from Sudan (30.1%, a difference of 0.030%), Scottish (30.1%, a difference of 0.060%), Immigrants from Liberia (30.1%, a difference of 0.090%), Immigrants from Cuba (30.1%, a difference of 0.10%), and Spaniard (30.2%, a difference of 0.20%).
| Demographics | Rating | Rank | Single Mother Poverty |
| Hungarians | 10.3 /100 | #218 | Poor 29.9% |
| Finns | 9.3 /100 | #219 | Tragic 30.0% |
| Germans | 8.8 /100 | #220 | Tragic 30.0% |
| Immigrants | Eritrea | 7.7 /100 | #221 | Tragic 30.0% |
| Sudanese | 7.6 /100 | #222 | Tragic 30.0% |
| Immigrants | Cuba | 6.9 /100 | #223 | Tragic 30.1% |
| Immigrants | Sudan | 6.5 /100 | #224 | Tragic 30.1% |
| Spanish | 6.3 /100 | #225 | Tragic 30.1% |
| Scottish | 6.0 /100 | #226 | Tragic 30.1% |
| Immigrants | Liberia | 5.9 /100 | #227 | Tragic 30.1% |
| Spaniards | 5.4 /100 | #228 | Tragic 30.2% |
| Immigrants | Barbados | 5.0 /100 | #229 | Tragic 30.2% |
| English | 4.8 /100 | #230 | Tragic 30.2% |
| Dutch | 4.3 /100 | #231 | Tragic 30.2% |
| Alaskan Athabascans | 4.1 /100 | #232 | Tragic 30.3% |
Demographics Similar to Nigerians by Single Mother Poverty
In terms of single mother poverty, the demographic groups most similar to Nigerians are Nepalese (29.3%, a difference of 0.010%), Immigrants from Eastern Africa (29.3%, a difference of 0.030%), Ghanaian (29.4%, a difference of 0.060%), Yugoslavian (29.4%, a difference of 0.10%), and Canadian (29.3%, a difference of 0.12%).
| Demographics | Rating | Rank | Single Mother Poverty |
| Immigrants | Bosnia and Herzegovina | 45.1 /100 | #177 | Average 29.2% |
| South American Indians | 43.2 /100 | #178 | Average 29.3% |
| Immigrants | Uzbekistan | 42.6 /100 | #179 | Average 29.3% |
| Immigrants | Norway | 41.5 /100 | #180 | Average 29.3% |
| Canadians | 40.4 /100 | #181 | Average 29.3% |
| Immigrants | Eastern Africa | 38.5 /100 | #182 | Fair 29.3% |
| Nepalese | 38.3 /100 | #183 | Fair 29.3% |
| Nigerians | 38.0 /100 | #184 | Fair 29.3% |
| Ghanaians | 36.8 /100 | #185 | Fair 29.4% |
| Yugoslavians | 36.0 /100 | #186 | Fair 29.4% |
| Lebanese | 32.5 /100 | #187 | Fair 29.4% |
| Guamanians/Chamorros | 31.8 /100 | #188 | Fair 29.4% |
| Immigrants | Africa | 31.6 /100 | #189 | Fair 29.4% |
| Immigrants | Germany | 30.4 /100 | #190 | Fair 29.5% |
| Immigrants | Trinidad and Tobago | 29.2 /100 | #191 | Fair 29.5% |