Spanish vs Immigrants from Iran Single Mother Poverty
COMPARE
Spanish
Immigrants from Iran
Single Mother Poverty
Single Mother Poverty Comparison
Spanish
Immigrants from Iran
30.1%
SINGLE MOTHER POVERTY
6.3/ 100
METRIC RATING
225th/ 347
METRIC RANK
25.1%
SINGLE MOTHER POVERTY
100.0/ 100
METRIC RATING
8th/ 347
METRIC RANK
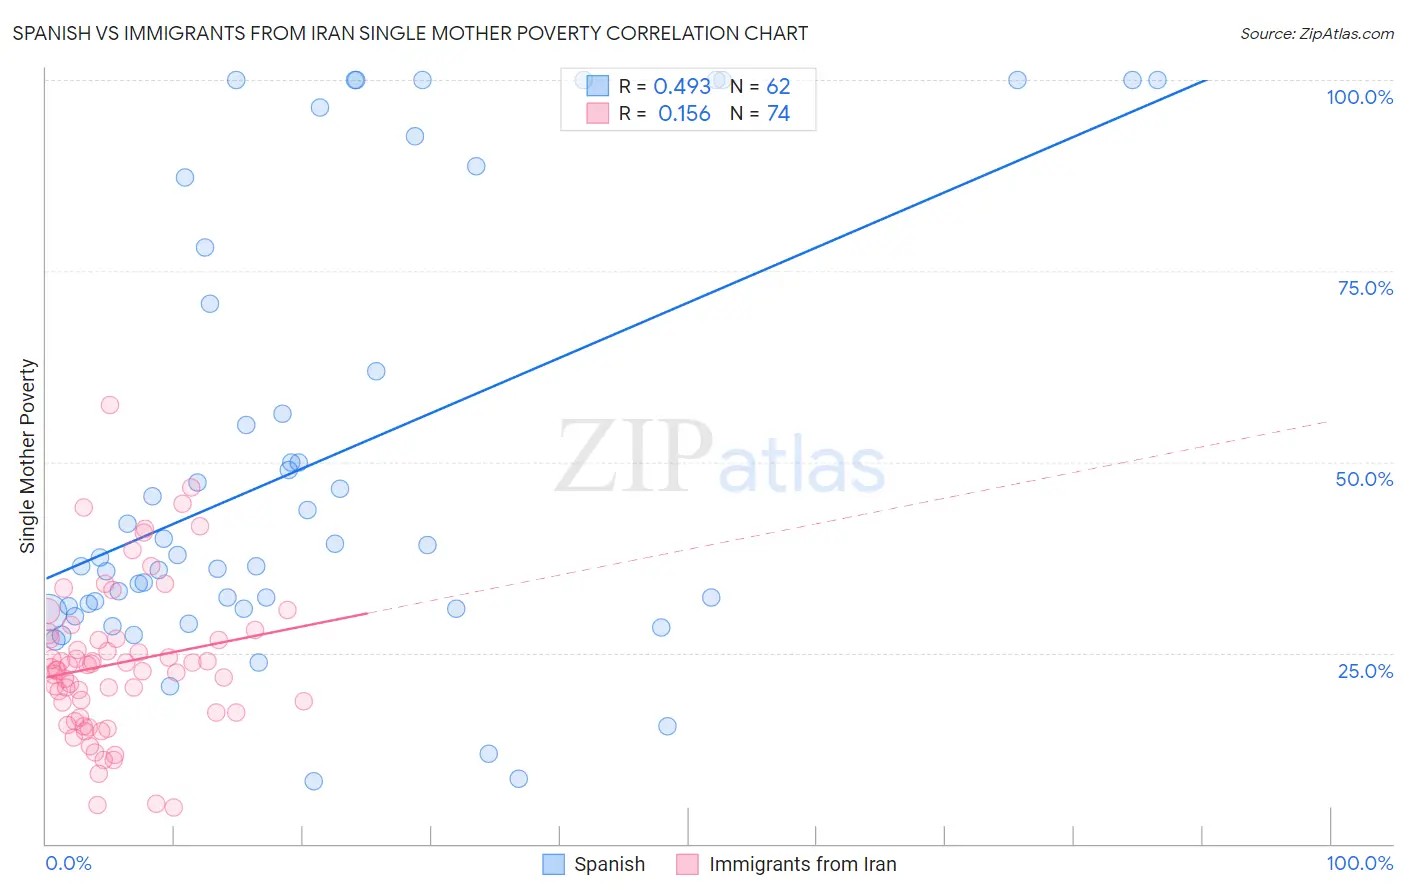
Spanish vs Immigrants from Iran Single Mother Poverty Correlation Chart
The statistical analysis conducted on geographies consisting of 411,729,340 people shows a moderate positive correlation between the proportion of Spanish and poverty level among single mothers in the United States with a correlation coefficient (R) of 0.493 and weighted average of 30.1%. Similarly, the statistical analysis conducted on geographies consisting of 273,886,487 people shows a poor positive correlation between the proportion of Immigrants from Iran and poverty level among single mothers in the United States with a correlation coefficient (R) of 0.156 and weighted average of 25.1%, a difference of 19.9%.
Single Mother Poverty Correlation Summary
| Measurement | Spanish | Immigrants from Iran |
| Minimum | 8.1% | 4.7% |
| Maximum | 100.0% | 57.5% |
| Range | 91.9% | 52.8% |
| Mean | 50.1% | 23.6% |
| Median | 37.7% | 22.9% |
| Interquartile 25% (IQ1) | 30.8% | 17.1% |
| Interquartile 75% (IQ3) | 70.7% | 26.8% |
| Interquartile Range (IQR) | 39.9% | 9.7% |
| Standard Deviation (Sample) | 28.6% | 10.0% |
| Standard Deviation (Population) | 28.4% | 9.9% |
Similar Demographics by Single Mother Poverty
Demographics Similar to Spanish by Single Mother Poverty
In terms of single mother poverty, the demographic groups most similar to Spanish are Immigrants from Sudan (30.1%, a difference of 0.030%), Scottish (30.1%, a difference of 0.060%), Immigrants from Liberia (30.1%, a difference of 0.090%), Immigrants from Cuba (30.1%, a difference of 0.10%), and Spaniard (30.2%, a difference of 0.20%).
| Demographics | Rating | Rank | Single Mother Poverty |
| Hungarians | 10.3 /100 | #218 | Poor 29.9% |
| Finns | 9.3 /100 | #219 | Tragic 30.0% |
| Germans | 8.8 /100 | #220 | Tragic 30.0% |
| Immigrants | Eritrea | 7.7 /100 | #221 | Tragic 30.0% |
| Sudanese | 7.6 /100 | #222 | Tragic 30.0% |
| Immigrants | Cuba | 6.9 /100 | #223 | Tragic 30.1% |
| Immigrants | Sudan | 6.5 /100 | #224 | Tragic 30.1% |
| Spanish | 6.3 /100 | #225 | Tragic 30.1% |
| Scottish | 6.0 /100 | #226 | Tragic 30.1% |
| Immigrants | Liberia | 5.9 /100 | #227 | Tragic 30.1% |
| Spaniards | 5.4 /100 | #228 | Tragic 30.2% |
| Immigrants | Barbados | 5.0 /100 | #229 | Tragic 30.2% |
| English | 4.8 /100 | #230 | Tragic 30.2% |
| Dutch | 4.3 /100 | #231 | Tragic 30.2% |
| Alaskan Athabascans | 4.1 /100 | #232 | Tragic 30.3% |
Demographics Similar to Immigrants from Iran by Single Mother Poverty
In terms of single mother poverty, the demographic groups most similar to Immigrants from Iran are Immigrants from Lithuania (25.2%, a difference of 0.41%), Immigrants from South Central Asia (25.3%, a difference of 0.60%), Iranian (25.5%, a difference of 1.7%), Chinese (24.6%, a difference of 2.0%), and Bhutanese (25.6%, a difference of 2.1%).
| Demographics | Rating | Rank | Single Mother Poverty |
| Assyrians/Chaldeans/Syriacs | 100.0 /100 | #1 | Exceptional 23.8% |
| Immigrants | India | 100.0 /100 | #2 | Exceptional 23.8% |
| Immigrants | Taiwan | 100.0 /100 | #3 | Exceptional 23.9% |
| Filipinos | 100.0 /100 | #4 | Exceptional 24.3% |
| Immigrants | Hong Kong | 100.0 /100 | #5 | Exceptional 24.4% |
| Thais | 100.0 /100 | #6 | Exceptional 24.5% |
| Chinese | 100.0 /100 | #7 | Exceptional 24.6% |
| Immigrants | Iran | 100.0 /100 | #8 | Exceptional 25.1% |
| Immigrants | Lithuania | 100.0 /100 | #9 | Exceptional 25.2% |
| Immigrants | South Central Asia | 100.0 /100 | #10 | Exceptional 25.3% |
| Iranians | 100.0 /100 | #11 | Exceptional 25.5% |
| Bhutanese | 100.0 /100 | #12 | Exceptional 25.6% |
| Indians (Asian) | 100.0 /100 | #13 | Exceptional 25.8% |
| Immigrants | Singapore | 100.0 /100 | #14 | Exceptional 25.8% |
| Immigrants | Ireland | 100.0 /100 | #15 | Exceptional 25.8% |