Spanish vs Immigrants from Jordan Householder Income Ages 45 - 64 years
COMPARE
Spanish
Immigrants from Jordan
Householder Income Ages 45 - 64 years
Householder Income Ages 45 - 64 years Comparison
Spanish
Immigrants from Jordan
$98,554
HOUSEHOLDER INCOME AGES 45 - 64 YEARS
29.2/ 100
METRIC RATING
195th/ 347
METRIC RANK
$106,164
HOUSEHOLDER INCOME AGES 45 - 64 YEARS
94.9/ 100
METRIC RATING
119th/ 347
METRIC RANK
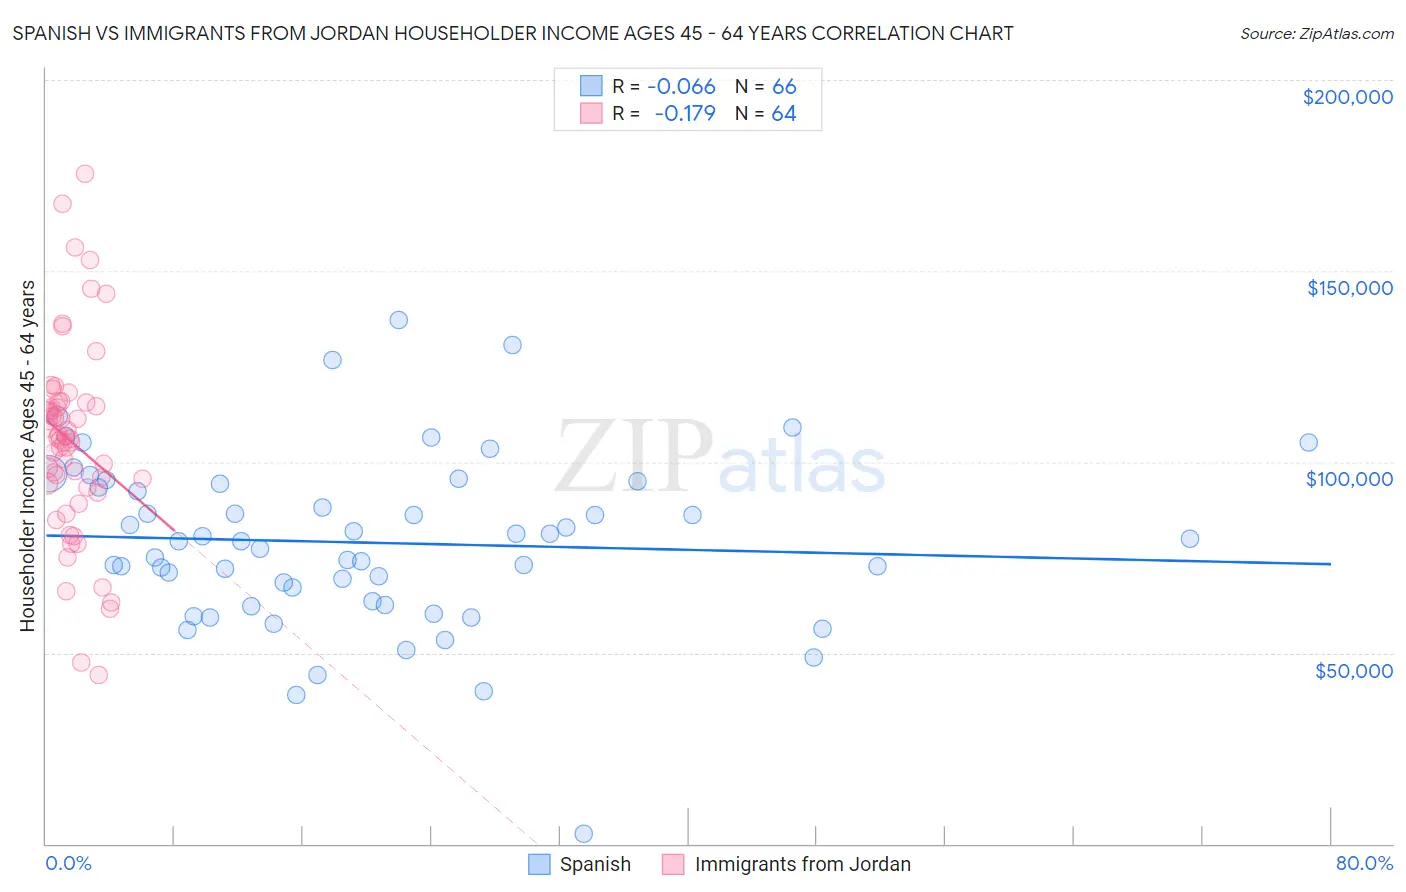
Spanish vs Immigrants from Jordan Householder Income Ages 45 - 64 years Correlation Chart
The statistical analysis conducted on geographies consisting of 421,243,274 people shows a slight negative correlation between the proportion of Spanish and household income with householder between the ages 45 and 64 in the United States with a correlation coefficient (R) of -0.066 and weighted average of $98,554. Similarly, the statistical analysis conducted on geographies consisting of 181,177,214 people shows a poor negative correlation between the proportion of Immigrants from Jordan and household income with householder between the ages 45 and 64 in the United States with a correlation coefficient (R) of -0.179 and weighted average of $106,164, a difference of 7.7%.
Householder Income Ages 45 - 64 years Correlation Summary
| Measurement | Spanish | Immigrants from Jordan |
| Minimum | $2,499 | $44,265 |
| Maximum | $137,143 | $175,361 |
| Range | $134,644 | $131,096 |
| Mean | $78,857 | $105,324 |
| Median | $79,247 | $106,275 |
| Interquartile 25% (IQ1) | $63,421 | $93,850 |
| Interquartile 75% (IQ3) | $94,394 | $114,914 |
| Interquartile Range (IQR) | $30,972 | $21,064 |
| Standard Deviation (Sample) | $22,794 | $25,270 |
| Standard Deviation (Population) | $22,620 | $25,072 |
Similar Demographics by Householder Income Ages 45 - 64 years
Demographics Similar to Spanish by Householder Income Ages 45 - 64 years
In terms of householder income ages 45 - 64 years, the demographic groups most similar to Spanish are Immigrants from Eastern Africa ($98,467, a difference of 0.090%), Uruguayan ($98,660, a difference of 0.11%), Puget Sound Salish ($98,340, a difference of 0.22%), Hawaiian ($98,778, a difference of 0.23%), and Celtic ($98,896, a difference of 0.35%).
| Demographics | Rating | Rank | Householder Income Ages 45 - 64 years |
| Immigrants | Portugal | 36.3 /100 | #188 | Fair $99,203 |
| Immigrants | South America | 35.4 /100 | #189 | Fair $99,126 |
| French Canadians | 35.1 /100 | #190 | Fair $99,093 |
| Kenyans | 33.7 /100 | #191 | Fair $98,970 |
| Celtics | 32.9 /100 | #192 | Fair $98,896 |
| Hawaiians | 31.6 /100 | #193 | Fair $98,778 |
| Uruguayans | 30.3 /100 | #194 | Fair $98,660 |
| Spanish | 29.2 /100 | #195 | Fair $98,554 |
| Immigrants | Eastern Africa | 28.3 /100 | #196 | Fair $98,467 |
| Puget Sound Salish | 27.0 /100 | #197 | Fair $98,340 |
| Immigrants | Iraq | 25.7 /100 | #198 | Fair $98,201 |
| Whites/Caucasians | 24.6 /100 | #199 | Fair $98,091 |
| Immigrants | Kenya | 23.5 /100 | #200 | Fair $97,964 |
| Yugoslavians | 20.0 /100 | #201 | Fair $97,558 |
| Tlingit-Haida | 18.9 /100 | #202 | Poor $97,417 |
Demographics Similar to Immigrants from Jordan by Householder Income Ages 45 - 64 years
In terms of householder income ages 45 - 64 years, the demographic groups most similar to Immigrants from Jordan are Immigrants from Western Asia ($106,217, a difference of 0.050%), Immigrants from South Eastern Asia ($106,109, a difference of 0.050%), Albanian ($106,243, a difference of 0.070%), British ($106,264, a difference of 0.090%), and Immigrants from Kuwait ($106,285, a difference of 0.11%).
| Demographics | Rating | Rank | Householder Income Ages 45 - 64 years |
| Swedes | 95.4 /100 | #112 | Exceptional $106,377 |
| Europeans | 95.4 /100 | #113 | Exceptional $106,367 |
| Immigrants | Poland | 95.3 /100 | #114 | Exceptional $106,319 |
| Immigrants | Kuwait | 95.2 /100 | #115 | Exceptional $106,285 |
| British | 95.2 /100 | #116 | Exceptional $106,264 |
| Albanians | 95.1 /100 | #117 | Exceptional $106,243 |
| Immigrants | Western Asia | 95.0 /100 | #118 | Exceptional $106,217 |
| Immigrants | Jordan | 94.9 /100 | #119 | Exceptional $106,164 |
| Immigrants | South Eastern Asia | 94.8 /100 | #120 | Exceptional $106,109 |
| Poles | 94.4 /100 | #121 | Exceptional $105,952 |
| Immigrants | North Macedonia | 94.2 /100 | #122 | Exceptional $105,892 |
| Danes | 93.4 /100 | #123 | Exceptional $105,619 |
| Immigrants | Northern Africa | 92.8 /100 | #124 | Exceptional $105,430 |
| Pakistanis | 92.4 /100 | #125 | Exceptional $105,317 |
| Portuguese | 92.4 /100 | #126 | Exceptional $105,309 |