Spanish vs Immigrants from Austria 5th Grade
COMPARE
Spanish
Immigrants from Austria
5th Grade
5th Grade Comparison
Spanish
Immigrants from Austria
97.6%
5TH GRADE
93.7/ 100
METRIC RATING
124th/ 347
METRIC RANK
97.9%
5TH GRADE
99.6/ 100
METRIC RATING
66th/ 347
METRIC RANK
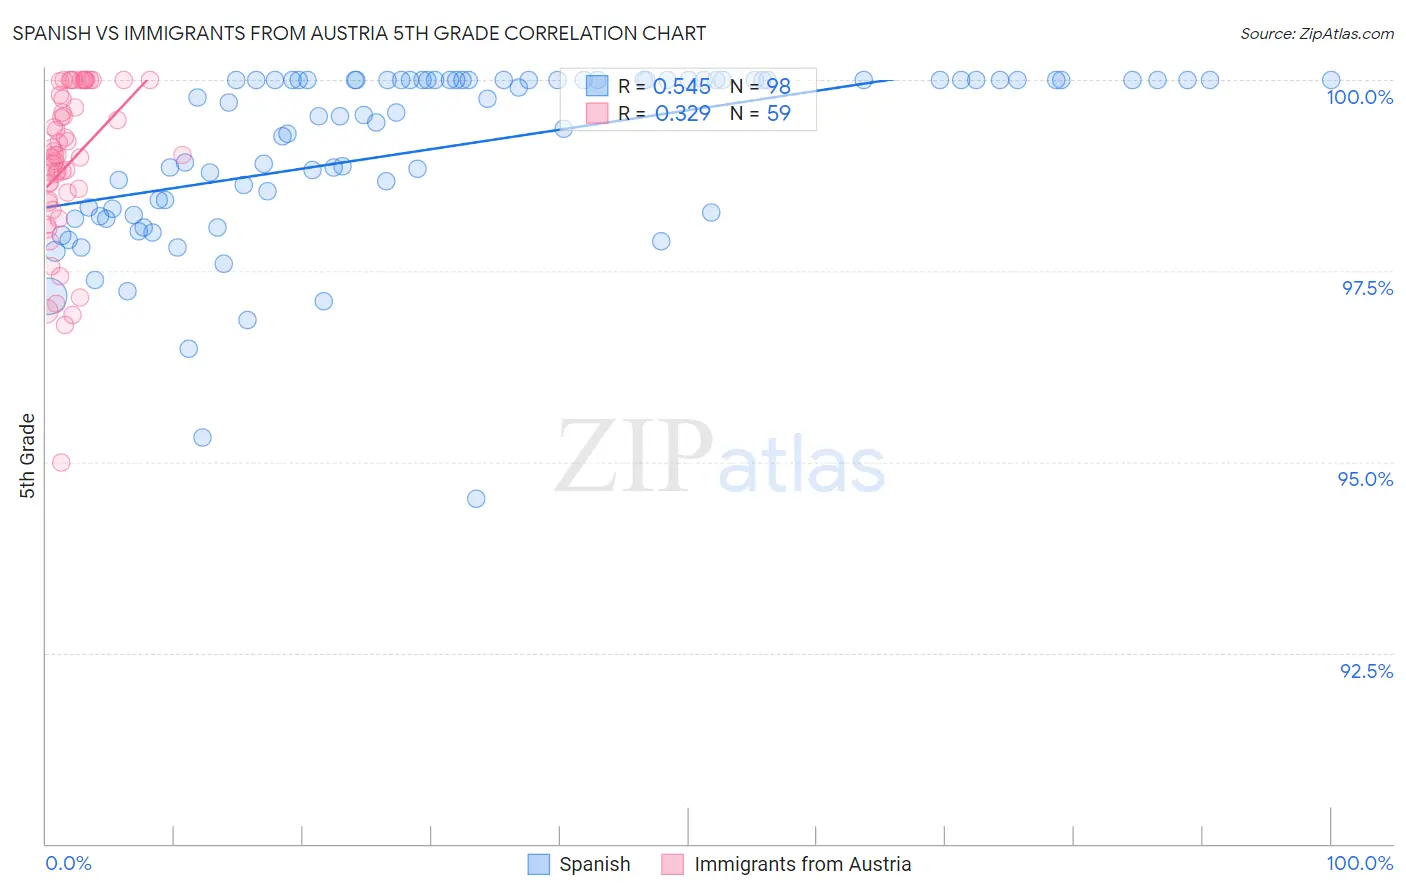
Spanish vs Immigrants from Austria 5th Grade Correlation Chart
The statistical analysis conducted on geographies consisting of 422,189,188 people shows a substantial positive correlation between the proportion of Spanish and percentage of population with at least 5th grade education in the United States with a correlation coefficient (R) of 0.545 and weighted average of 97.6%. Similarly, the statistical analysis conducted on geographies consisting of 167,973,800 people shows a mild positive correlation between the proportion of Immigrants from Austria and percentage of population with at least 5th grade education in the United States with a correlation coefficient (R) of 0.329 and weighted average of 97.9%, a difference of 0.30%.
5th Grade Correlation Summary
| Measurement | Spanish | Immigrants from Austria |
| Minimum | 94.5% | 95.0% |
| Maximum | 100.0% | 100.0% |
| Range | 5.5% | 5.0% |
| Mean | 99.1% | 98.9% |
| Median | 99.7% | 99.0% |
| Interquartile 25% (IQ1) | 98.3% | 98.4% |
| Interquartile 75% (IQ3) | 100.0% | 99.8% |
| Interquartile Range (IQR) | 1.7% | 1.4% |
| Standard Deviation (Sample) | 1.1% | 1.0% |
| Standard Deviation (Population) | 1.1% | 1.0% |
Similar Demographics by 5th Grade
Demographics Similar to Spanish by 5th Grade
In terms of 5th grade, the demographic groups most similar to Spanish are Immigrants from Bulgaria (97.6%, a difference of 0.010%), Immigrants from Zimbabwe (97.6%, a difference of 0.020%), Immigrants from France (97.6%, a difference of 0.020%), Immigrants from Japan (97.6%, a difference of 0.020%), and Immigrants from Norway (97.6%, a difference of 0.020%).
| Demographics | Rating | Rank | 5th Grade |
| Immigrants | Saudi Arabia | 95.4 /100 | #117 | Exceptional 97.6% |
| Basques | 95.2 /100 | #118 | Exceptional 97.6% |
| Syrians | 95.1 /100 | #119 | Exceptional 97.6% |
| Immigrants | Zimbabwe | 94.9 /100 | #120 | Exceptional 97.6% |
| Immigrants | France | 94.8 /100 | #121 | Exceptional 97.6% |
| Immigrants | Japan | 94.7 /100 | #122 | Exceptional 97.6% |
| Immigrants | Norway | 94.6 /100 | #123 | Exceptional 97.6% |
| Spanish | 93.7 /100 | #124 | Exceptional 97.6% |
| Immigrants | Bulgaria | 93.1 /100 | #125 | Exceptional 97.6% |
| Hmong | 92.3 /100 | #126 | Exceptional 97.6% |
| Immigrants | Serbia | 92.3 /100 | #127 | Exceptional 97.6% |
| Colville | 92.0 /100 | #128 | Exceptional 97.6% |
| Immigrants | Europe | 91.9 /100 | #129 | Exceptional 97.6% |
| Immigrants | Romania | 91.6 /100 | #130 | Exceptional 97.6% |
| Pima | 91.2 /100 | #131 | Exceptional 97.6% |
Demographics Similar to Immigrants from Austria by 5th Grade
In terms of 5th grade, the demographic groups most similar to Immigrants from Austria are Canadian (97.9%, a difference of 0.0%), New Zealander (97.9%, a difference of 0.0%), Immigrants from Northern Europe (97.9%, a difference of 0.010%), Cajun (97.9%, a difference of 0.010%), and Russian (97.9%, a difference of 0.020%).
| Demographics | Rating | Rank | 5th Grade |
| Americans | 99.7 /100 | #59 | Exceptional 97.9% |
| Immigrants | Canada | 99.7 /100 | #60 | Exceptional 97.9% |
| Serbians | 99.7 /100 | #61 | Exceptional 97.9% |
| Immigrants | North America | 99.7 /100 | #62 | Exceptional 97.9% |
| Russians | 99.7 /100 | #63 | Exceptional 97.9% |
| Immigrants | Northern Europe | 99.6 /100 | #64 | Exceptional 97.9% |
| Canadians | 99.6 /100 | #65 | Exceptional 97.9% |
| Immigrants | Austria | 99.6 /100 | #66 | Exceptional 97.9% |
| New Zealanders | 99.6 /100 | #67 | Exceptional 97.9% |
| Cajuns | 99.6 /100 | #68 | Exceptional 97.9% |
| Kiowa | 99.5 /100 | #69 | Exceptional 97.9% |
| Iranians | 99.5 /100 | #70 | Exceptional 97.9% |
| Chickasaw | 99.5 /100 | #71 | Exceptional 97.9% |
| Macedonians | 99.4 /100 | #72 | Exceptional 97.9% |
| Cherokee | 99.4 /100 | #73 | Exceptional 97.8% |