Spanish vs Bermudan In Labor Force | Age 16-19
COMPARE
Spanish
Bermudan
In Labor Force | Age 16-19
In Labor Force | Age 16-19 Comparison
Spanish
Bermudans
39.3%
IN LABOR FORCE | AGE 16-19
99.7/ 100
METRIC RATING
83rd/ 347
METRIC RANK
36.9%
IN LABOR FORCE | AGE 16-19
69.3/ 100
METRIC RATING
163rd/ 347
METRIC RANK
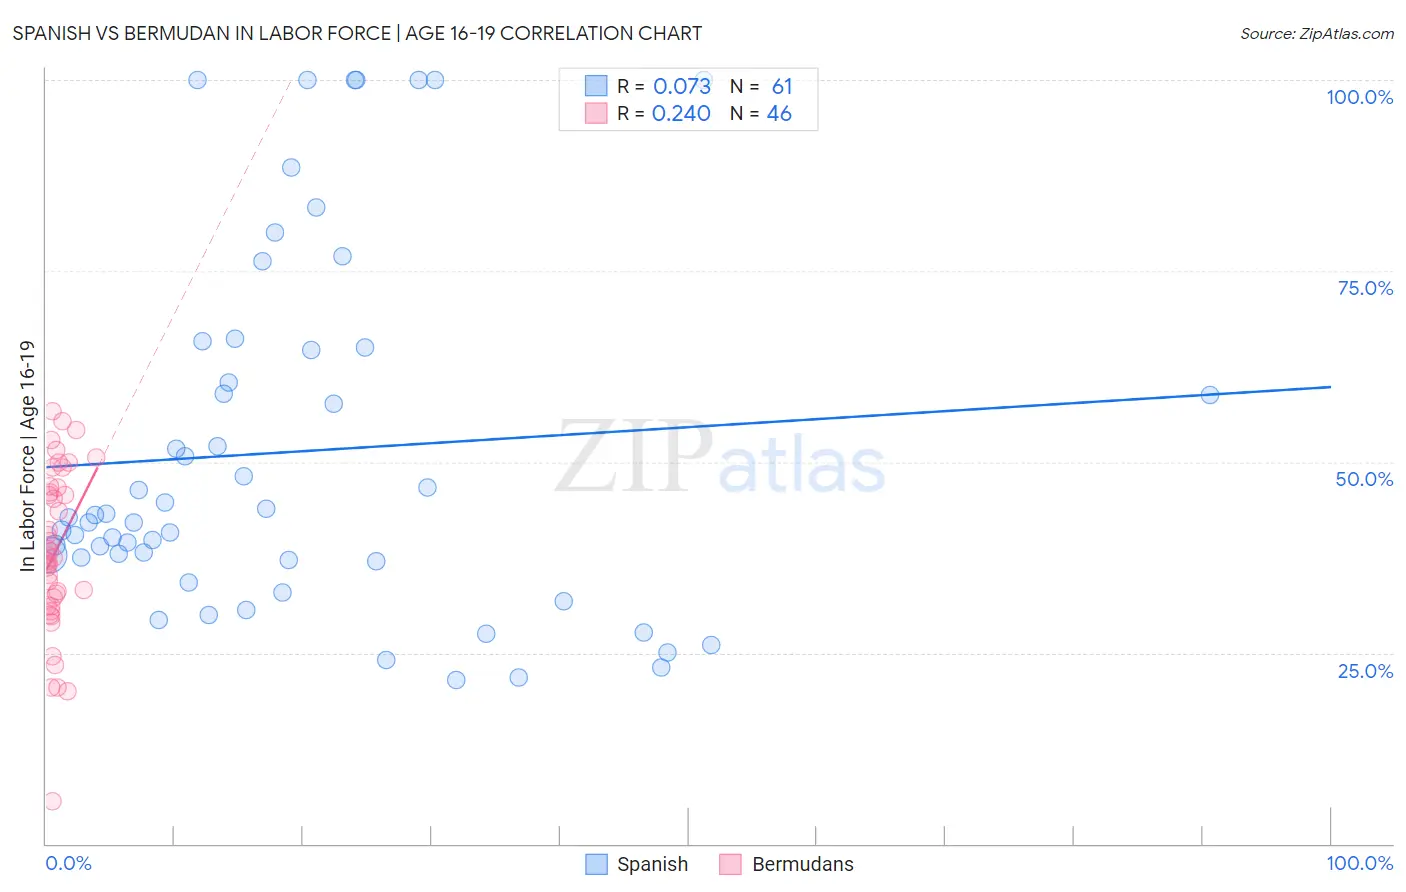
Spanish vs Bermudan In Labor Force | Age 16-19 Correlation Chart
The statistical analysis conducted on geographies consisting of 421,181,243 people shows a slight positive correlation between the proportion of Spanish and labor force participation rate among population between the ages 16 and 19 in the United States with a correlation coefficient (R) of 0.073 and weighted average of 39.3%. Similarly, the statistical analysis conducted on geographies consisting of 55,701,640 people shows a weak positive correlation between the proportion of Bermudans and labor force participation rate among population between the ages 16 and 19 in the United States with a correlation coefficient (R) of 0.240 and weighted average of 36.9%, a difference of 6.3%.
In Labor Force | Age 16-19 Correlation Summary
| Measurement | Spanish | Bermudan |
| Minimum | 21.4% | 5.6% |
| Maximum | 100.0% | 56.7% |
| Range | 78.6% | 51.1% |
| Mean | 51.3% | 38.2% |
| Median | 42.7% | 37.6% |
| Interquartile 25% (IQ1) | 37.1% | 31.2% |
| Interquartile 75% (IQ3) | 64.9% | 46.6% |
| Interquartile Range (IQR) | 27.8% | 15.4% |
| Standard Deviation (Sample) | 23.5% | 10.9% |
| Standard Deviation (Population) | 23.3% | 10.8% |
Similar Demographics by In Labor Force | Age 16-19
Demographics Similar to Spanish by In Labor Force | Age 16-19
In terms of in labor force | age 16-19, the demographic groups most similar to Spanish are Basque (39.3%, a difference of 0.020%), Shoshone (39.3%, a difference of 0.080%), Immigrants from Uganda (39.2%, a difference of 0.13%), Creek (39.1%, a difference of 0.28%), and Samoan (39.1%, a difference of 0.30%).
| Demographics | Rating | Rank | In Labor Force | Age 16-19 |
| Malaysians | 99.9 /100 | #76 | Exceptional 39.7% |
| Immigrants | Portugal | 99.9 /100 | #77 | Exceptional 39.7% |
| Austrians | 99.8 /100 | #78 | Exceptional 39.5% |
| Marshallese | 99.8 /100 | #79 | Exceptional 39.5% |
| Immigrants | Iraq | 99.8 /100 | #80 | Exceptional 39.4% |
| Shoshone | 99.7 /100 | #81 | Exceptional 39.3% |
| Basques | 99.7 /100 | #82 | Exceptional 39.3% |
| Spanish | 99.7 /100 | #83 | Exceptional 39.3% |
| Immigrants | Uganda | 99.7 /100 | #84 | Exceptional 39.2% |
| Creek | 99.6 /100 | #85 | Exceptional 39.1% |
| Samoans | 99.6 /100 | #86 | Exceptional 39.1% |
| Immigrants | Germany | 99.6 /100 | #87 | Exceptional 39.1% |
| Puget Sound Salish | 99.6 /100 | #88 | Exceptional 39.1% |
| Alaska Natives | 99.6 /100 | #89 | Exceptional 39.1% |
| Immigrants | Burma/Myanmar | 99.5 /100 | #90 | Exceptional 39.0% |
Demographics Similar to Bermudans by In Labor Force | Age 16-19
In terms of in labor force | age 16-19, the demographic groups most similar to Bermudans are Immigrants from Jordan (36.9%, a difference of 0.010%), Immigrants from Kuwait (36.9%, a difference of 0.020%), Cambodian (37.0%, a difference of 0.13%), Yakama (36.9%, a difference of 0.14%), and Immigrants from Western Africa (36.9%, a difference of 0.15%).
| Demographics | Rating | Rank | In Labor Force | Age 16-19 |
| Kiowa | 80.4 /100 | #156 | Excellent 37.2% |
| Immigrants | Brazil | 76.5 /100 | #157 | Good 37.1% |
| Ute | 75.7 /100 | #158 | Good 37.1% |
| Yaqui | 74.4 /100 | #159 | Good 37.1% |
| Immigrants | Saudi Arabia | 73.9 /100 | #160 | Good 37.0% |
| Cambodians | 71.5 /100 | #161 | Good 37.0% |
| Immigrants | Jordan | 69.5 /100 | #162 | Good 36.9% |
| Bermudans | 69.3 /100 | #163 | Good 36.9% |
| Immigrants | Kuwait | 68.9 /100 | #164 | Good 36.9% |
| Yakama | 66.9 /100 | #165 | Good 36.9% |
| Immigrants | Western Africa | 66.7 /100 | #166 | Good 36.9% |
| Arabs | 63.6 /100 | #167 | Good 36.8% |
| Palestinians | 63.1 /100 | #168 | Good 36.8% |
| Immigrants | Latvia | 61.6 /100 | #169 | Good 36.8% |
| Immigrants | South Africa | 60.5 /100 | #170 | Good 36.8% |