Spanish American Indian vs Immigrants from Fiji Receiving Food Stamps
COMPARE
Spanish American Indian
Immigrants from Fiji
Receiving Food Stamps
Receiving Food Stamps Comparison
Spanish American Indians
Immigrants from Fiji
14.9%
RECEIVING FOOD STAMPS
0.0/ 100
METRIC RATING
281st/ 347
METRIC RANK
12.1%
RECEIVING FOOD STAMPS
27.8/ 100
METRIC RATING
193rd/ 347
METRIC RANK
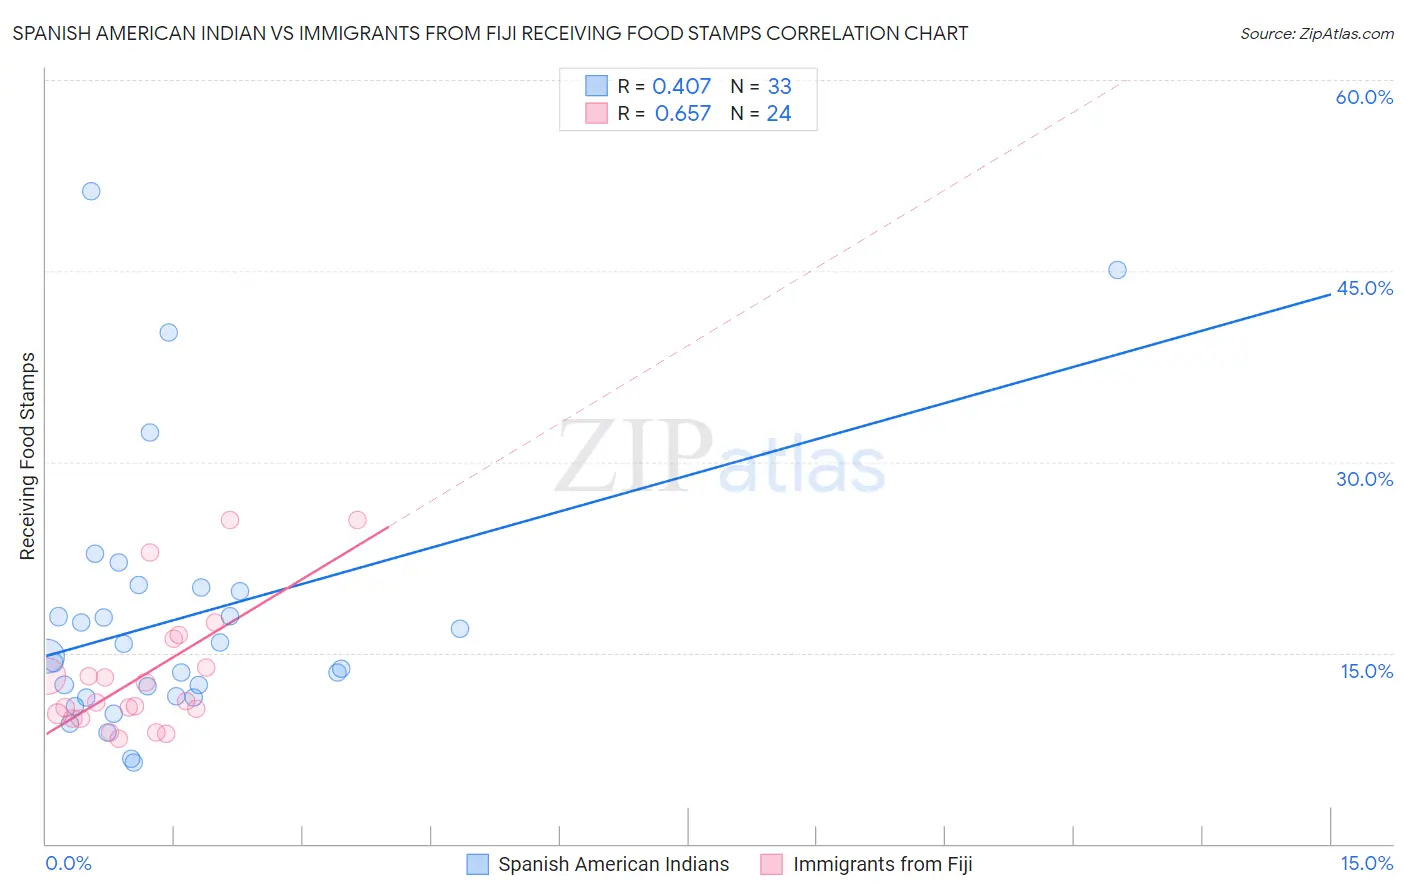
Spanish American Indian vs Immigrants from Fiji Receiving Food Stamps Correlation Chart
The statistical analysis conducted on geographies consisting of 73,107,965 people shows a moderate positive correlation between the proportion of Spanish American Indians and percentage of population receiving government assistance and/or food stamps in the United States with a correlation coefficient (R) of 0.407 and weighted average of 14.9%. Similarly, the statistical analysis conducted on geographies consisting of 93,752,896 people shows a significant positive correlation between the proportion of Immigrants from Fiji and percentage of population receiving government assistance and/or food stamps in the United States with a correlation coefficient (R) of 0.657 and weighted average of 12.1%, a difference of 23.0%.
Receiving Food Stamps Correlation Summary
| Measurement | Spanish American Indian | Immigrants from Fiji |
| Minimum | 6.4% | 8.3% |
| Maximum | 51.3% | 25.4% |
| Range | 44.9% | 17.2% |
| Mean | 17.8% | 13.3% |
| Median | 14.7% | 11.1% |
| Interquartile 25% (IQ1) | 11.5% | 10.0% |
| Interquartile 75% (IQ3) | 20.0% | 14.9% |
| Interquartile Range (IQR) | 8.5% | 4.9% |
| Standard Deviation (Sample) | 10.4% | 5.0% |
| Standard Deviation (Population) | 10.2% | 4.9% |
Similar Demographics by Receiving Food Stamps
Demographics Similar to Spanish American Indians by Receiving Food Stamps
In terms of receiving food stamps, the demographic groups most similar to Spanish American Indians are Ecuadorian (14.9%, a difference of 0.32%), Kiowa (14.9%, a difference of 0.37%), Immigrants from Central America (15.0%, a difference of 0.52%), Belizean (14.8%, a difference of 0.64%), and Seminole (14.8%, a difference of 0.77%).
| Demographics | Rating | Rank | Receiving Food Stamps |
| Immigrants | Western Africa | 0.1 /100 | #274 | Tragic 14.7% |
| Ute | 0.1 /100 | #275 | Tragic 14.7% |
| Liberians | 0.1 /100 | #276 | Tragic 14.8% |
| Seminole | 0.1 /100 | #277 | Tragic 14.8% |
| Belizeans | 0.1 /100 | #278 | Tragic 14.8% |
| Kiowa | 0.0 /100 | #279 | Tragic 14.9% |
| Ecuadorians | 0.0 /100 | #280 | Tragic 14.9% |
| Spanish American Indians | 0.0 /100 | #281 | Tragic 14.9% |
| Immigrants | Central America | 0.0 /100 | #282 | Tragic 15.0% |
| Bangladeshis | 0.0 /100 | #283 | Tragic 15.0% |
| Immigrants | Ecuador | 0.0 /100 | #284 | Tragic 15.0% |
| Immigrants | Liberia | 0.0 /100 | #285 | Tragic 15.1% |
| Africans | 0.0 /100 | #286 | Tragic 15.1% |
| Immigrants | Mexico | 0.0 /100 | #287 | Tragic 15.2% |
| Immigrants | Belize | 0.0 /100 | #288 | Tragic 15.2% |
Demographics Similar to Immigrants from Fiji by Receiving Food Stamps
In terms of receiving food stamps, the demographic groups most similar to Immigrants from Fiji are Immigrants from Sudan (12.1%, a difference of 0.12%), American (12.2%, a difference of 0.18%), Iraqi (12.2%, a difference of 0.21%), Delaware (12.2%, a difference of 0.28%), and Immigrants from Costa Rica (12.2%, a difference of 0.42%).
| Demographics | Rating | Rank | Receiving Food Stamps |
| Spanish | 36.9 /100 | #186 | Fair 12.0% |
| Albanians | 35.4 /100 | #187 | Fair 12.0% |
| Sudanese | 33.4 /100 | #188 | Fair 12.0% |
| Immigrants | Cameroon | 32.5 /100 | #189 | Fair 12.0% |
| Immigrants | Peru | 32.2 /100 | #190 | Fair 12.0% |
| Venezuelans | 32.1 /100 | #191 | Fair 12.0% |
| Samoans | 31.0 /100 | #192 | Fair 12.1% |
| Immigrants | Fiji | 27.8 /100 | #193 | Fair 12.1% |
| Immigrants | Sudan | 27.1 /100 | #194 | Fair 12.1% |
| Americans | 26.7 /100 | #195 | Fair 12.2% |
| Iraqis | 26.6 /100 | #196 | Fair 12.2% |
| Delaware | 26.1 /100 | #197 | Fair 12.2% |
| Immigrants | Costa Rica | 25.4 /100 | #198 | Fair 12.2% |
| Portuguese | 25.1 /100 | #199 | Fair 12.2% |
| Sierra Leoneans | 23.6 /100 | #200 | Fair 12.2% |