Spanish American Indian vs Immigrants from Dominica Single Male Poverty
COMPARE
Spanish American Indian
Immigrants from Dominica
Single Male Poverty
Single Male Poverty Comparison
Spanish American Indians
Immigrants from Dominica
12.1%
SINGLE MALE POVERTY
98.0/ 100
METRIC RATING
92nd/ 347
METRIC RANK
14.5%
SINGLE MALE POVERTY
0.0/ 100
METRIC RATING
289th/ 347
METRIC RANK
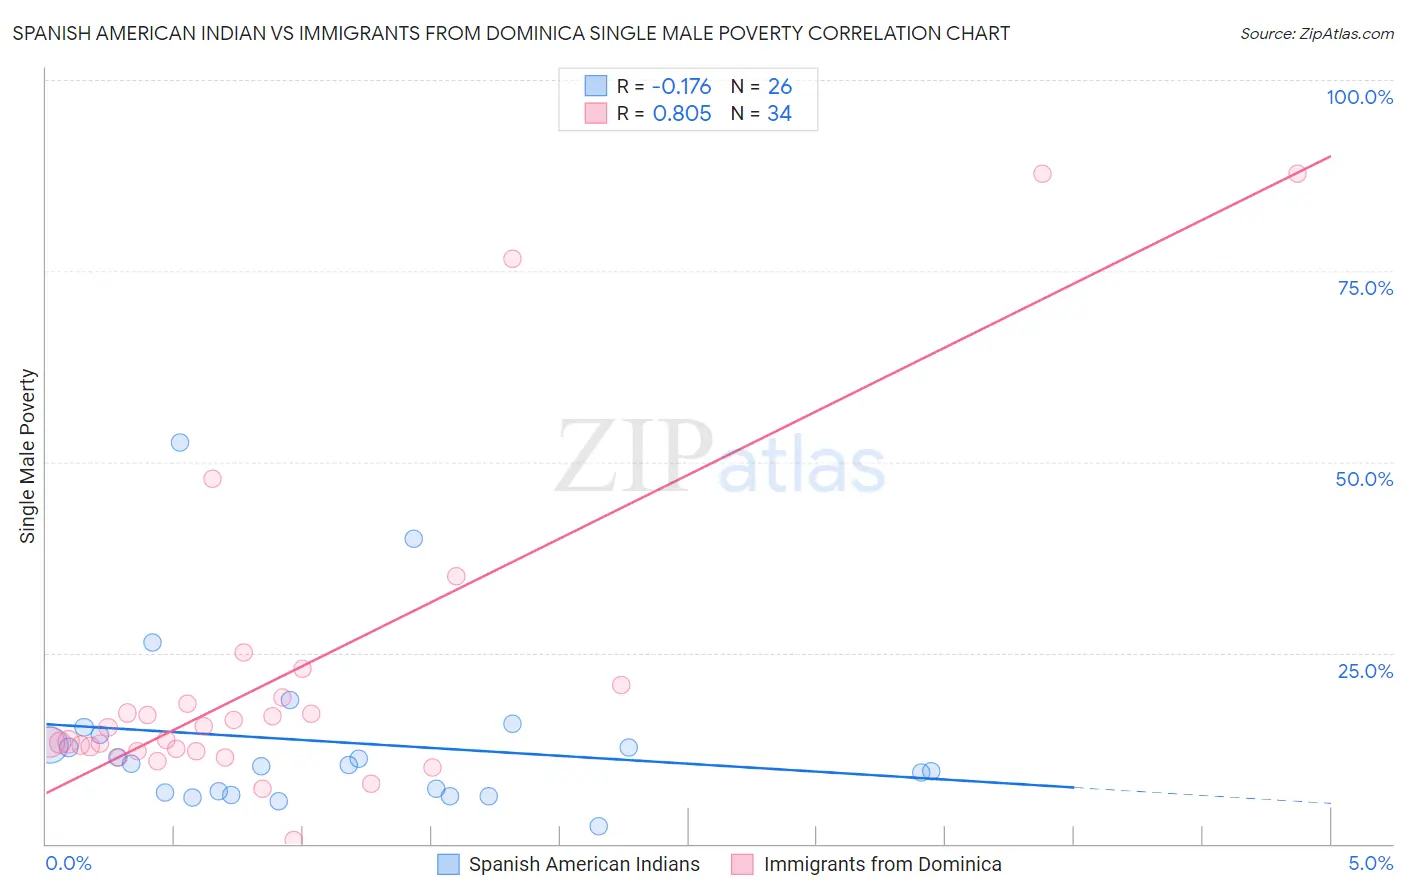
Spanish American Indian vs Immigrants from Dominica Single Male Poverty Correlation Chart
The statistical analysis conducted on geographies consisting of 71,838,653 people shows a poor negative correlation between the proportion of Spanish American Indians and poverty level among single males in the United States with a correlation coefficient (R) of -0.176 and weighted average of 12.1%. Similarly, the statistical analysis conducted on geographies consisting of 81,406,108 people shows a very strong positive correlation between the proportion of Immigrants from Dominica and poverty level among single males in the United States with a correlation coefficient (R) of 0.805 and weighted average of 14.5%, a difference of 19.4%.
Single Male Poverty Correlation Summary
| Measurement | Spanish American Indian | Immigrants from Dominica |
| Minimum | 2.3% | 0.56% |
| Maximum | 52.6% | 87.7% |
| Range | 50.3% | 87.1% |
| Mean | 13.4% | 21.9% |
| Median | 10.4% | 14.4% |
| Interquartile 25% (IQ1) | 6.8% | 12.1% |
| Interquartile 75% (IQ3) | 14.2% | 19.1% |
| Interquartile Range (IQR) | 7.4% | 7.0% |
| Standard Deviation (Sample) | 11.0% | 21.3% |
| Standard Deviation (Population) | 10.8% | 20.9% |
Similar Demographics by Single Male Poverty
Demographics Similar to Spanish American Indians by Single Male Poverty
In terms of single male poverty, the demographic groups most similar to Spanish American Indians are Immigrants from Bosnia and Herzegovina (12.1%, a difference of 0.060%), Immigrants from Turkey (12.1%, a difference of 0.11%), Immigrants from Ireland (12.1%, a difference of 0.16%), South American Indian (12.1%, a difference of 0.16%), and Colombian (12.2%, a difference of 0.18%).
| Demographics | Rating | Rank | Single Male Poverty |
| Turks | 98.5 /100 | #85 | Exceptional 12.1% |
| Immigrants | Israel | 98.5 /100 | #86 | Exceptional 12.1% |
| South Americans | 98.5 /100 | #87 | Exceptional 12.1% |
| Immigrants | Eritrea | 98.5 /100 | #88 | Exceptional 12.1% |
| Immigrants | Ireland | 98.3 /100 | #89 | Exceptional 12.1% |
| South American Indians | 98.3 /100 | #90 | Exceptional 12.1% |
| Immigrants | Turkey | 98.2 /100 | #91 | Exceptional 12.1% |
| Spanish American Indians | 98.0 /100 | #92 | Exceptional 12.1% |
| Immigrants | Bosnia and Herzegovina | 97.9 /100 | #93 | Exceptional 12.1% |
| Colombians | 97.8 /100 | #94 | Exceptional 12.2% |
| Mongolians | 97.7 /100 | #95 | Exceptional 12.2% |
| Immigrants | Sweden | 97.5 /100 | #96 | Exceptional 12.2% |
| Immigrants | Italy | 97.4 /100 | #97 | Exceptional 12.2% |
| Guamanians/Chamorros | 97.4 /100 | #98 | Exceptional 12.2% |
| Immigrants | Cuba | 97.3 /100 | #99 | Exceptional 12.2% |
Demographics Similar to Immigrants from Dominica by Single Male Poverty
In terms of single male poverty, the demographic groups most similar to Immigrants from Dominica are Iroquois (14.5%, a difference of 0.090%), White/Caucasian (14.5%, a difference of 0.090%), Celtic (14.5%, a difference of 0.22%), U.S. Virgin Islander (14.5%, a difference of 0.23%), and Bahamian (14.6%, a difference of 0.38%).
| Demographics | Rating | Rank | Single Male Poverty |
| Spanish Americans | 0.0 /100 | #282 | Tragic 14.2% |
| Yaqui | 0.0 /100 | #283 | Tragic 14.2% |
| Immigrants | Bahamas | 0.0 /100 | #284 | Tragic 14.4% |
| French | 0.0 /100 | #285 | Tragic 14.4% |
| Celtics | 0.0 /100 | #286 | Tragic 14.5% |
| Iroquois | 0.0 /100 | #287 | Tragic 14.5% |
| Whites/Caucasians | 0.0 /100 | #288 | Tragic 14.5% |
| Immigrants | Dominica | 0.0 /100 | #289 | Tragic 14.5% |
| U.S. Virgin Islanders | 0.0 /100 | #290 | Tragic 14.5% |
| Bahamians | 0.0 /100 | #291 | Tragic 14.6% |
| Immigrants | Nonimmigrants | 0.0 /100 | #292 | Tragic 14.6% |
| French Canadians | 0.0 /100 | #293 | Tragic 14.6% |
| Ottawa | 0.0 /100 | #294 | Tragic 14.6% |
| Scotch-Irish | 0.0 /100 | #295 | Tragic 14.7% |
| Africans | 0.0 /100 | #296 | Tragic 14.7% |