Spanish American Indian vs Immigrants from Sierra Leone Disability Age 18 to 34
COMPARE
Spanish American Indian
Immigrants from Sierra Leone
Disability Age 18 to 34
Disability Age 18 to 34 Comparison
Spanish American Indians
Immigrants from Sierra Leone
6.4%
DISABILITY AGE 18 TO 34
87.7/ 100
METRIC RATING
138th/ 347
METRIC RANK
6.5%
DISABILITY AGE 18 TO 34
75.0/ 100
METRIC RATING
157th/ 347
METRIC RANK
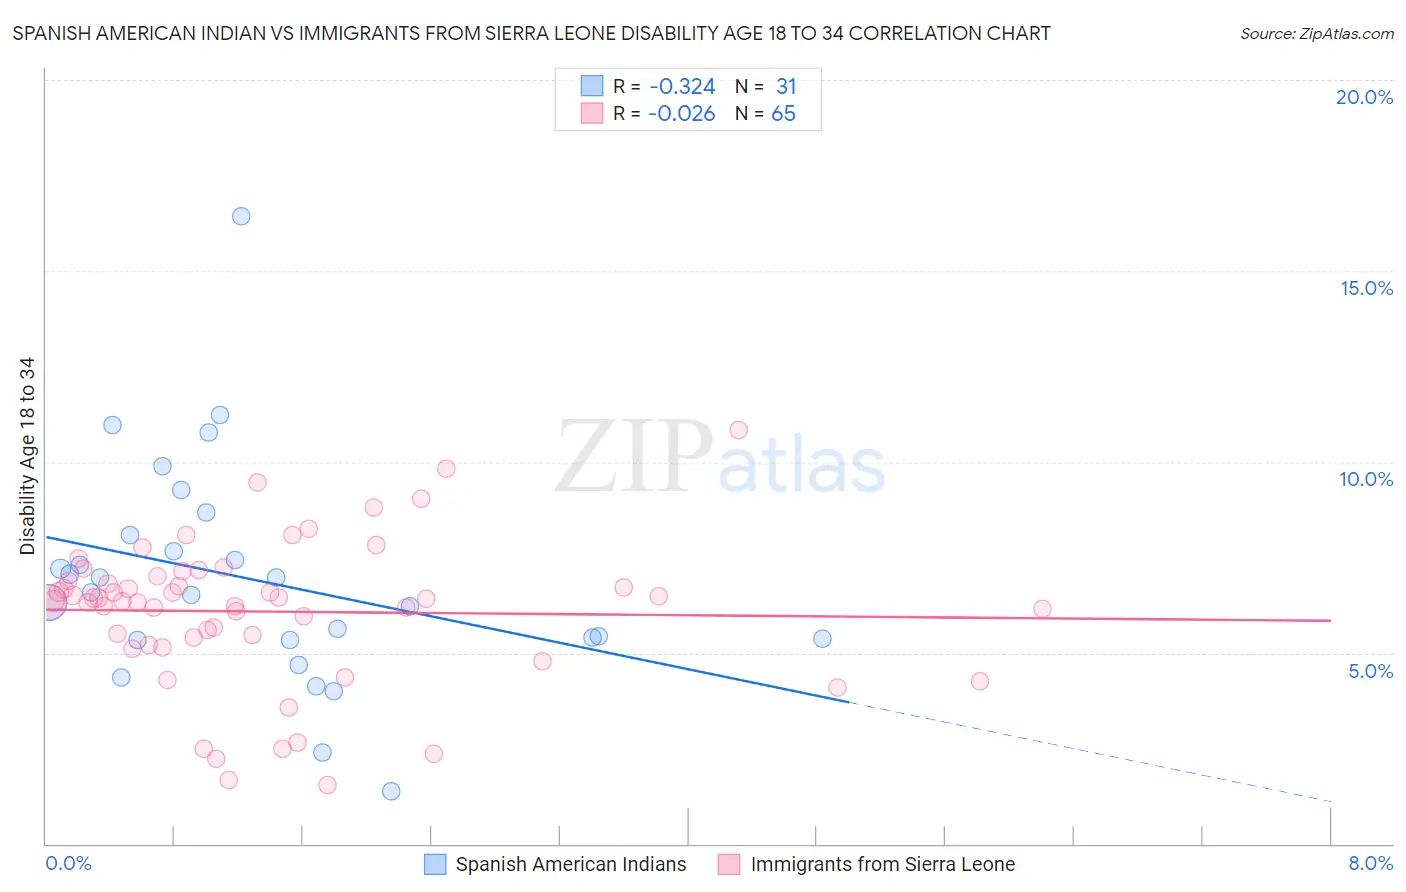
Spanish American Indian vs Immigrants from Sierra Leone Disability Age 18 to 34 Correlation Chart
The statistical analysis conducted on geographies consisting of 73,116,969 people shows a mild negative correlation between the proportion of Spanish American Indians and percentage of population with a disability between the ages 18 and 35 in the United States with a correlation coefficient (R) of -0.324 and weighted average of 6.4%. Similarly, the statistical analysis conducted on geographies consisting of 101,637,669 people shows no correlation between the proportion of Immigrants from Sierra Leone and percentage of population with a disability between the ages 18 and 35 in the United States with a correlation coefficient (R) of -0.026 and weighted average of 6.5%, a difference of 1.6%.
Disability Age 18 to 34 Correlation Summary
| Measurement | Spanish American Indian | Immigrants from Sierra Leone |
| Minimum | 1.4% | 1.6% |
| Maximum | 16.4% | 10.8% |
| Range | 15.1% | 9.3% |
| Mean | 6.9% | 6.1% |
| Median | 6.6% | 6.4% |
| Interquartile 25% (IQ1) | 5.3% | 5.3% |
| Interquartile 75% (IQ3) | 8.1% | 6.9% |
| Interquartile Range (IQR) | 2.7% | 1.6% |
| Standard Deviation (Sample) | 2.9% | 1.9% |
| Standard Deviation (Population) | 2.9% | 1.9% |
Demographics Similar to Spanish American Indians and Immigrants from Sierra Leone by Disability Age 18 to 34
In terms of disability age 18 to 34, the demographic groups most similar to Spanish American Indians are Immigrants from Honduras (6.4%, a difference of 0.0%), Immigrants from Belize (6.4%, a difference of 0.050%), Immigrants from Fiji (6.4%, a difference of 0.070%), Jamaican (6.4%, a difference of 0.16%), and South American Indian (6.4%, a difference of 0.19%). Similarly, the demographic groups most similar to Immigrants from Sierra Leone are Immigrants from Panama (6.5%, a difference of 0.030%), Immigrants from Central America (6.5%, a difference of 0.17%), Inupiat (6.5%, a difference of 0.17%), Immigrants from Eritrea (6.5%, a difference of 0.23%), and Bulgarian (6.5%, a difference of 0.32%).
| Demographics | Rating | Rank | Disability Age 18 to 34 |
| Immigrants | Honduras | 87.7 /100 | #137 | Excellent 6.4% |
| Spanish American Indians | 87.7 /100 | #138 | Excellent 6.4% |
| Immigrants | Belize | 87.4 /100 | #139 | Excellent 6.4% |
| Immigrants | Fiji | 87.3 /100 | #140 | Excellent 6.4% |
| Jamaicans | 86.8 /100 | #141 | Excellent 6.4% |
| South American Indians | 86.5 /100 | #142 | Excellent 6.4% |
| Immigrants | Latvia | 86.4 /100 | #143 | Excellent 6.4% |
| Albanians | 85.3 /100 | #144 | Excellent 6.4% |
| Moroccans | 85.2 /100 | #145 | Excellent 6.4% |
| Belizeans | 84.9 /100 | #146 | Excellent 6.4% |
| Immigrants | South Africa | 83.7 /100 | #147 | Excellent 6.4% |
| Immigrants | Belgium | 83.5 /100 | #148 | Excellent 6.4% |
| Hondurans | 83.1 /100 | #149 | Excellent 6.4% |
| Immigrants | Dominican Republic | 82.7 /100 | #150 | Excellent 6.4% |
| Tongans | 81.9 /100 | #151 | Excellent 6.4% |
| Bulgarians | 78.3 /100 | #152 | Good 6.5% |
| Immigrants | Eritrea | 77.4 /100 | #153 | Good 6.5% |
| Immigrants | Central America | 76.8 /100 | #154 | Good 6.5% |
| Inupiat | 76.7 /100 | #155 | Good 6.5% |
| Immigrants | Panama | 75.3 /100 | #156 | Good 6.5% |
| Immigrants | Sierra Leone | 75.0 /100 | #157 | Good 6.5% |