Immigrants from Cameroon vs Immigrants from Fiji Receiving Food Stamps
COMPARE
Immigrants from Cameroon
Immigrants from Fiji
Receiving Food Stamps
Receiving Food Stamps Comparison
Immigrants from Cameroon
Immigrants from Fiji
12.0%
RECEIVING FOOD STAMPS
32.5/ 100
METRIC RATING
189th/ 347
METRIC RANK
12.1%
RECEIVING FOOD STAMPS
27.8/ 100
METRIC RATING
193rd/ 347
METRIC RANK
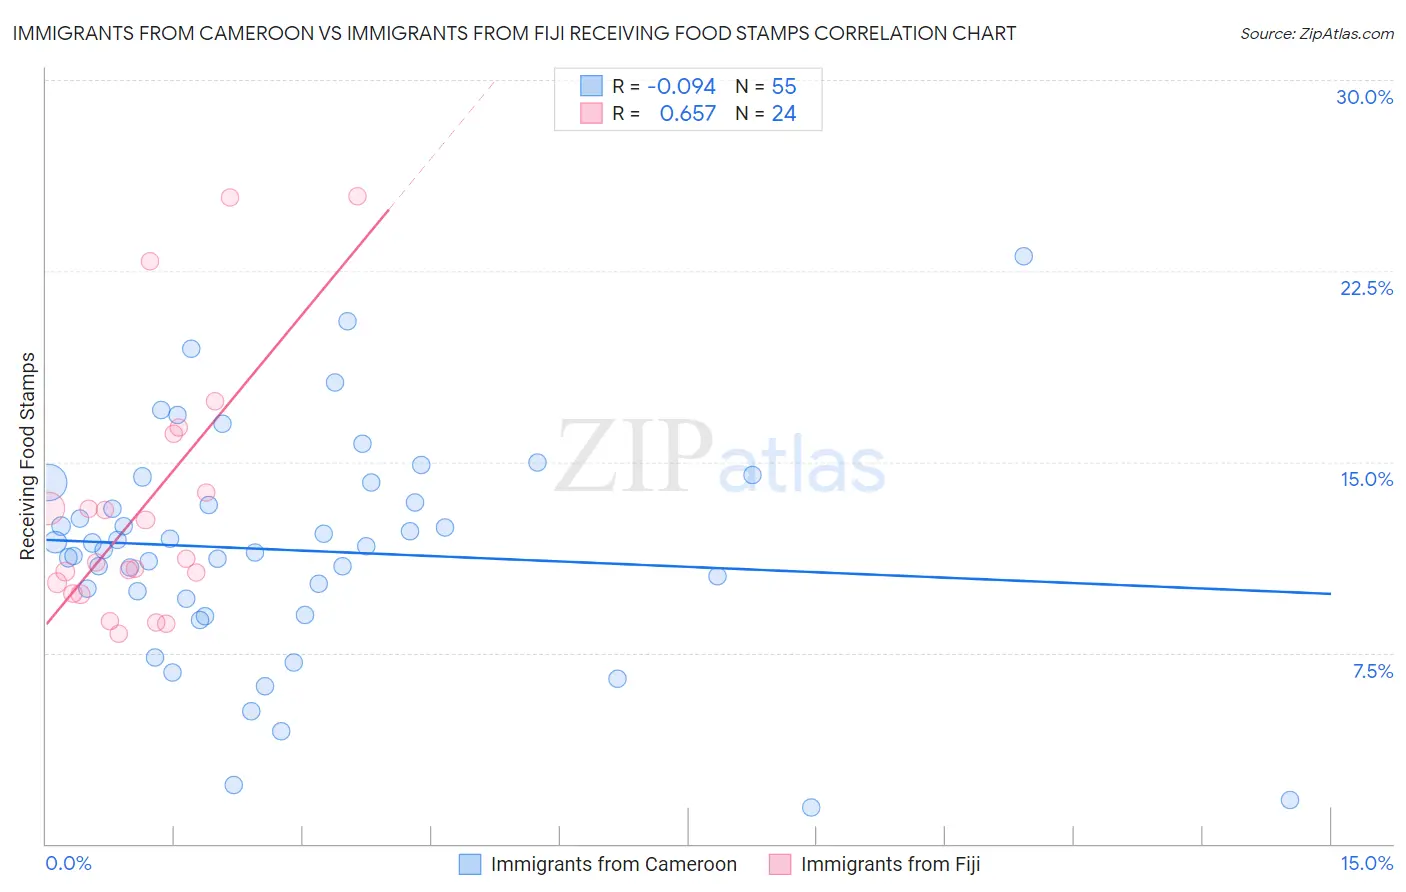
Immigrants from Cameroon vs Immigrants from Fiji Receiving Food Stamps Correlation Chart
The statistical analysis conducted on geographies consisting of 130,693,457 people shows a slight negative correlation between the proportion of Immigrants from Cameroon and percentage of population receiving government assistance and/or food stamps in the United States with a correlation coefficient (R) of -0.094 and weighted average of 12.0%. Similarly, the statistical analysis conducted on geographies consisting of 93,752,896 people shows a significant positive correlation between the proportion of Immigrants from Fiji and percentage of population receiving government assistance and/or food stamps in the United States with a correlation coefficient (R) of 0.657 and weighted average of 12.1%, a difference of 0.77%.
Receiving Food Stamps Correlation Summary
| Measurement | Immigrants from Cameroon | Immigrants from Fiji |
| Minimum | 1.4% | 8.3% |
| Maximum | 23.1% | 25.4% |
| Range | 21.7% | 17.2% |
| Mean | 11.5% | 13.3% |
| Median | 11.7% | 11.1% |
| Interquartile 25% (IQ1) | 9.6% | 10.0% |
| Interquartile 75% (IQ3) | 14.2% | 14.9% |
| Interquartile Range (IQR) | 4.6% | 4.9% |
| Standard Deviation (Sample) | 4.3% | 5.0% |
| Standard Deviation (Population) | 4.3% | 4.9% |
Demographics Similar to Immigrants from Cameroon and Immigrants from Fiji by Receiving Food Stamps
In terms of receiving food stamps, the demographic groups most similar to Immigrants from Cameroon are Immigrants from Peru (12.0%, a difference of 0.060%), Venezuelan (12.0%, a difference of 0.060%), Sudanese (12.0%, a difference of 0.14%), Samoan (12.1%, a difference of 0.24%), and Albanian (12.0%, a difference of 0.44%). Similarly, the demographic groups most similar to Immigrants from Fiji are Immigrants from Sudan (12.1%, a difference of 0.12%), American (12.2%, a difference of 0.18%), Iraqi (12.2%, a difference of 0.21%), Delaware (12.2%, a difference of 0.28%), and Immigrants from Costa Rica (12.2%, a difference of 0.42%).
| Demographics | Rating | Rank | Receiving Food Stamps |
| South American Indians | 41.7 /100 | #181 | Average 11.9% |
| Immigrants | Morocco | 40.7 /100 | #182 | Average 11.9% |
| Immigrants | Uganda | 40.3 /100 | #183 | Average 11.9% |
| Spaniards | 39.8 /100 | #184 | Fair 11.9% |
| Immigrants | Iraq | 37.1 /100 | #185 | Fair 12.0% |
| Spanish | 36.9 /100 | #186 | Fair 12.0% |
| Albanians | 35.4 /100 | #187 | Fair 12.0% |
| Sudanese | 33.4 /100 | #188 | Fair 12.0% |
| Immigrants | Cameroon | 32.5 /100 | #189 | Fair 12.0% |
| Immigrants | Peru | 32.2 /100 | #190 | Fair 12.0% |
| Venezuelans | 32.1 /100 | #191 | Fair 12.0% |
| Samoans | 31.0 /100 | #192 | Fair 12.1% |
| Immigrants | Fiji | 27.8 /100 | #193 | Fair 12.1% |
| Immigrants | Sudan | 27.1 /100 | #194 | Fair 12.1% |
| Americans | 26.7 /100 | #195 | Fair 12.2% |
| Iraqis | 26.6 /100 | #196 | Fair 12.2% |
| Delaware | 26.1 /100 | #197 | Fair 12.2% |
| Immigrants | Costa Rica | 25.4 /100 | #198 | Fair 12.2% |
| Portuguese | 25.1 /100 | #199 | Fair 12.2% |
| Sierra Leoneans | 23.6 /100 | #200 | Fair 12.2% |
| Ugandans | 22.5 /100 | #201 | Fair 12.2% |