Inupiat vs Immigrants from Saudi Arabia Male Poverty
COMPARE
Inupiat
Immigrants from Saudi Arabia
Male Poverty
Male Poverty Comparison
Inupiat
Immigrants from Saudi Arabia
14.0%
MALE POVERTY
0.0/ 100
METRIC RATING
297th/ 347
METRIC RANK
12.7%
MALE POVERTY
0.4/ 100
METRIC RATING
236th/ 347
METRIC RANK
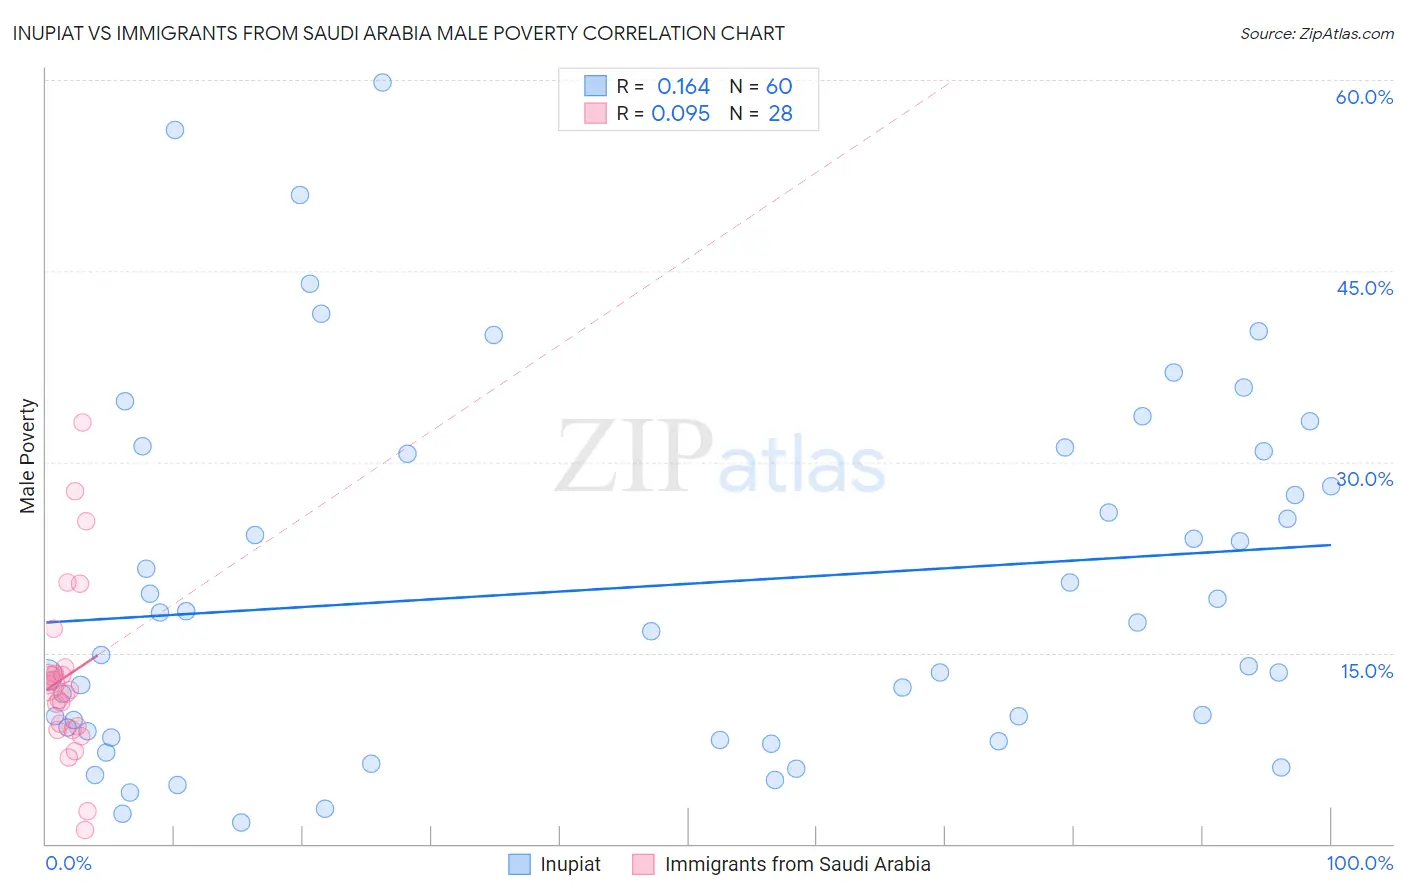
Inupiat vs Immigrants from Saudi Arabia Male Poverty Correlation Chart
The statistical analysis conducted on geographies consisting of 96,314,568 people shows a poor positive correlation between the proportion of Inupiat and poverty level among males in the United States with a correlation coefficient (R) of 0.164 and weighted average of 14.0%. Similarly, the statistical analysis conducted on geographies consisting of 164,207,457 people shows a slight positive correlation between the proportion of Immigrants from Saudi Arabia and poverty level among males in the United States with a correlation coefficient (R) of 0.095 and weighted average of 12.7%, a difference of 10.4%.
Male Poverty Correlation Summary
| Measurement | Inupiat | Immigrants from Saudi Arabia |
| Minimum | 1.7% | 1.1% |
| Maximum | 59.8% | 33.1% |
| Range | 58.1% | 32.0% |
| Mean | 20.1% | 13.2% |
| Median | 17.0% | 12.3% |
| Interquartile 25% (IQ1) | 8.6% | 9.1% |
| Interquartile 75% (IQ3) | 30.7% | 13.6% |
| Interquartile Range (IQR) | 22.1% | 4.5% |
| Standard Deviation (Sample) | 14.1% | 7.0% |
| Standard Deviation (Population) | 14.0% | 6.9% |
Similar Demographics by Male Poverty
Demographics Similar to Inupiat by Male Poverty
In terms of male poverty, the demographic groups most similar to Inupiat are Blackfeet (14.0%, a difference of 0.030%), Immigrants from Guatemala (14.0%, a difference of 0.13%), Immigrants from Mexico (14.0%, a difference of 0.25%), Immigrants from Senegal (14.0%, a difference of 0.32%), and Immigrants from Caribbean (14.0%, a difference of 0.37%).
| Demographics | Rating | Rank | Male Poverty |
| Immigrants | Zaire | 0.0 /100 | #290 | Tragic 13.8% |
| Vietnamese | 0.0 /100 | #291 | Tragic 13.8% |
| Indonesians | 0.0 /100 | #292 | Tragic 13.8% |
| Immigrants | Belize | 0.0 /100 | #293 | Tragic 13.8% |
| Hispanics or Latinos | 0.0 /100 | #294 | Tragic 13.9% |
| Immigrants | Central America | 0.0 /100 | #295 | Tragic 13.9% |
| Cajuns | 0.0 /100 | #296 | Tragic 13.9% |
| Inupiat | 0.0 /100 | #297 | Tragic 14.0% |
| Blackfeet | 0.0 /100 | #298 | Tragic 14.0% |
| Immigrants | Guatemala | 0.0 /100 | #299 | Tragic 14.0% |
| Immigrants | Mexico | 0.0 /100 | #300 | Tragic 14.0% |
| Immigrants | Senegal | 0.0 /100 | #301 | Tragic 14.0% |
| Immigrants | Caribbean | 0.0 /100 | #302 | Tragic 14.0% |
| Bahamians | 0.0 /100 | #303 | Tragic 14.1% |
| Senegalese | 0.0 /100 | #304 | Tragic 14.1% |
Demographics Similar to Immigrants from Saudi Arabia by Male Poverty
In terms of male poverty, the demographic groups most similar to Immigrants from Saudi Arabia are French American Indian (12.7%, a difference of 0.050%), Ecuadorian (12.7%, a difference of 0.080%), Ghanaian (12.7%, a difference of 0.080%), Immigrants from Laos (12.6%, a difference of 0.25%), and Immigrants from Middle Africa (12.7%, a difference of 0.35%).
| Demographics | Rating | Rank | Male Poverty |
| Cubans | 1.3 /100 | #229 | Tragic 12.4% |
| Marshallese | 0.8 /100 | #230 | Tragic 12.5% |
| Salvadorans | 0.6 /100 | #231 | Tragic 12.6% |
| Nicaraguans | 0.6 /100 | #232 | Tragic 12.6% |
| Fijians | 0.6 /100 | #233 | Tragic 12.6% |
| Immigrants | Armenia | 0.6 /100 | #234 | Tragic 12.6% |
| Immigrants | Laos | 0.5 /100 | #235 | Tragic 12.6% |
| Immigrants | Saudi Arabia | 0.4 /100 | #236 | Tragic 12.7% |
| French American Indians | 0.4 /100 | #237 | Tragic 12.7% |
| Ecuadorians | 0.4 /100 | #238 | Tragic 12.7% |
| Ghanaians | 0.4 /100 | #239 | Tragic 12.7% |
| Immigrants | Middle Africa | 0.4 /100 | #240 | Tragic 12.7% |
| Sudanese | 0.3 /100 | #241 | Tragic 12.8% |
| Nepalese | 0.3 /100 | #242 | Tragic 12.8% |
| Alaskan Athabascans | 0.3 /100 | #243 | Tragic 12.8% |