Soviet Union vs Polish Unemployment
COMPARE
Soviet Union
Polish
Unemployment
Unemployment Comparison
Soviet Union
Poles
5.4%
UNEMPLOYMENT
10.6/ 100
METRIC RATING
220th/ 347
METRIC RANK
4.7%
UNEMPLOYMENT
99.8/ 100
METRIC RATING
29th/ 347
METRIC RANK
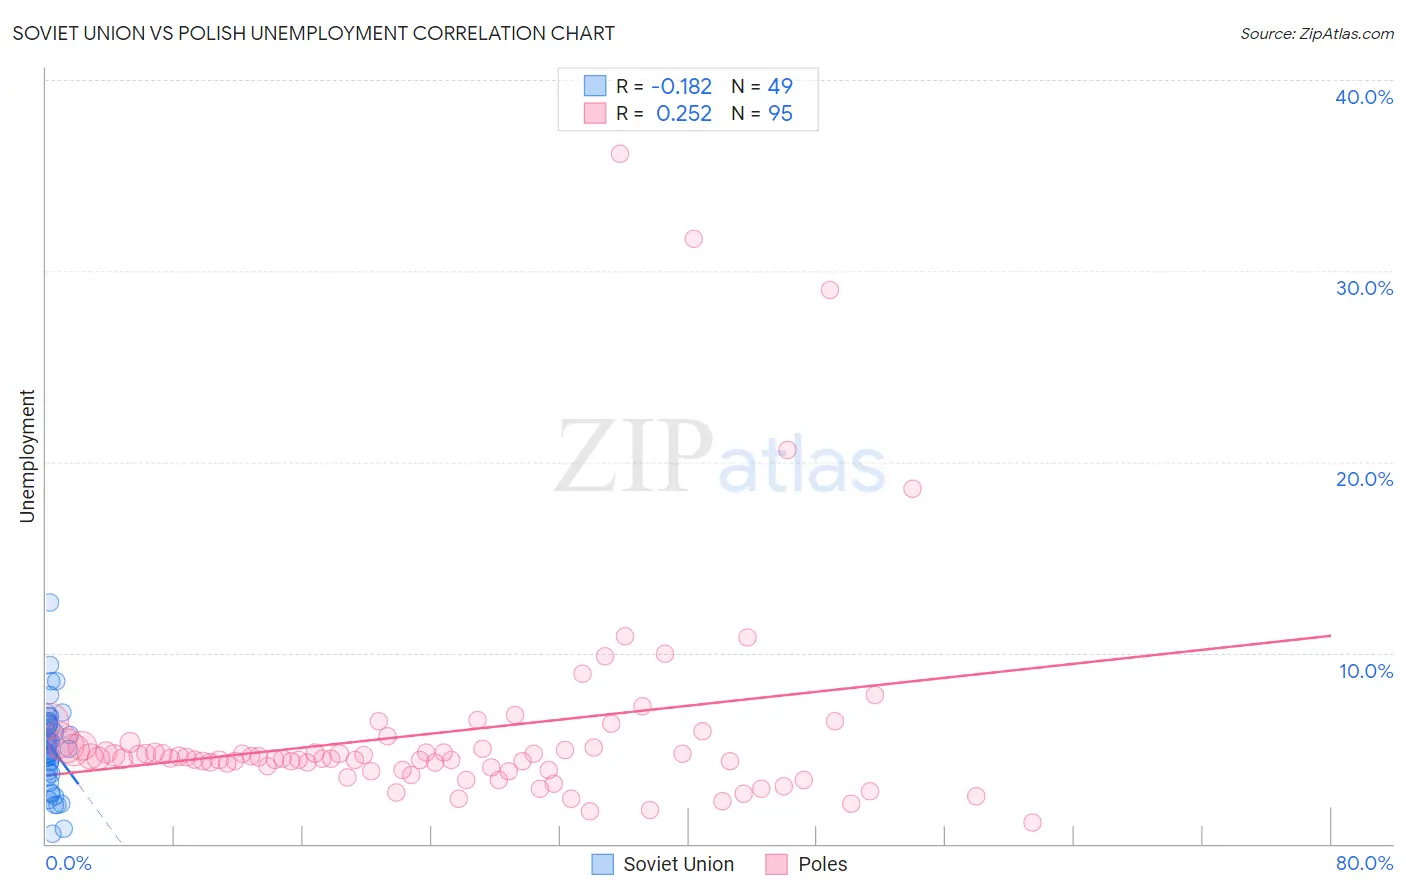
Soviet Union vs Polish Unemployment Correlation Chart
The statistical analysis conducted on geographies consisting of 43,502,228 people shows a poor negative correlation between the proportion of Soviet Union and unemployment in the United States with a correlation coefficient (R) of -0.182 and weighted average of 5.4%. Similarly, the statistical analysis conducted on geographies consisting of 557,090,134 people shows a weak positive correlation between the proportion of Poles and unemployment in the United States with a correlation coefficient (R) of 0.252 and weighted average of 4.7%, a difference of 14.4%.
Unemployment Correlation Summary
| Measurement | Soviet Union | Polish |
| Minimum | 0.50% | 1.1% |
| Maximum | 12.6% | 36.2% |
| Range | 12.1% | 35.1% |
| Mean | 5.1% | 5.8% |
| Median | 5.2% | 4.5% |
| Interquartile 25% (IQ1) | 3.7% | 3.9% |
| Interquartile 75% (IQ3) | 6.2% | 5.1% |
| Interquartile Range (IQR) | 2.5% | 1.2% |
| Standard Deviation (Sample) | 2.2% | 5.6% |
| Standard Deviation (Population) | 2.2% | 5.5% |
Similar Demographics by Unemployment
Demographics Similar to Soviet Union by Unemployment
In terms of unemployment, the demographic groups most similar to Soviet Union are Immigrants from Philippines (5.4%, a difference of 0.040%), Iroquois (5.4%, a difference of 0.060%), Bangladeshi (5.4%, a difference of 0.080%), Seminole (5.4%, a difference of 0.25%), and Choctaw (5.4%, a difference of 0.30%).
| Demographics | Rating | Rank | Unemployment |
| Immigrants | Middle Africa | 15.3 /100 | #213 | Poor 5.4% |
| Immigrants | Costa Rica | 15.2 /100 | #214 | Poor 5.4% |
| Delaware | 14.7 /100 | #215 | Poor 5.4% |
| Immigrants | South America | 13.5 /100 | #216 | Poor 5.4% |
| Immigrants | Albania | 13.5 /100 | #217 | Poor 5.4% |
| Choctaw | 12.7 /100 | #218 | Poor 5.4% |
| Bangladeshis | 11.2 /100 | #219 | Poor 5.4% |
| Soviet Union | 10.6 /100 | #220 | Poor 5.4% |
| Immigrants | Philippines | 10.4 /100 | #221 | Poor 5.4% |
| Iroquois | 10.3 /100 | #222 | Poor 5.4% |
| Seminole | 9.2 /100 | #223 | Tragic 5.4% |
| Israelis | 8.8 /100 | #224 | Tragic 5.4% |
| South American Indians | 7.8 /100 | #225 | Tragic 5.5% |
| Samoans | 7.1 /100 | #226 | Tragic 5.5% |
| Immigrants | Lebanon | 7.0 /100 | #227 | Tragic 5.5% |
Demographics Similar to Poles by Unemployment
In terms of unemployment, the demographic groups most similar to Poles are Cuban (4.7%, a difference of 0.12%), Irish (4.8%, a difference of 0.24%), Croatian (4.8%, a difference of 0.26%), Zimbabwean (4.8%, a difference of 0.36%), and Sudanese (4.8%, a difference of 0.37%).
| Demographics | Rating | Rank | Unemployment |
| Thais | 99.9 /100 | #22 | Exceptional 4.7% |
| British | 99.9 /100 | #23 | Exceptional 4.7% |
| Venezuelans | 99.9 /100 | #24 | Exceptional 4.7% |
| Latvians | 99.9 /100 | #25 | Exceptional 4.7% |
| Bulgarians | 99.9 /100 | #26 | Exceptional 4.7% |
| Finns | 99.9 /100 | #27 | Exceptional 4.7% |
| Cubans | 99.8 /100 | #28 | Exceptional 4.7% |
| Poles | 99.8 /100 | #29 | Exceptional 4.7% |
| Irish | 99.8 /100 | #30 | Exceptional 4.8% |
| Croatians | 99.8 /100 | #31 | Exceptional 4.8% |
| Zimbabweans | 99.8 /100 | #32 | Exceptional 4.8% |
| Sudanese | 99.8 /100 | #33 | Exceptional 4.8% |
| Immigrants | Bolivia | 99.8 /100 | #34 | Exceptional 4.8% |
| Scotch-Irish | 99.8 /100 | #35 | Exceptional 4.8% |
| Tongans | 99.7 /100 | #36 | Exceptional 4.8% |