South American vs Immigrants from Ecuador Single Female Poverty
COMPARE
South American
Immigrants from Ecuador
Single Female Poverty
Single Female Poverty Comparison
South Americans
Immigrants from Ecuador
20.0%
SINGLE FEMALE POVERTY
95.1/ 100
METRIC RATING
120th/ 347
METRIC RANK
22.0%
SINGLE FEMALE POVERTY
4.2/ 100
METRIC RATING
236th/ 347
METRIC RANK
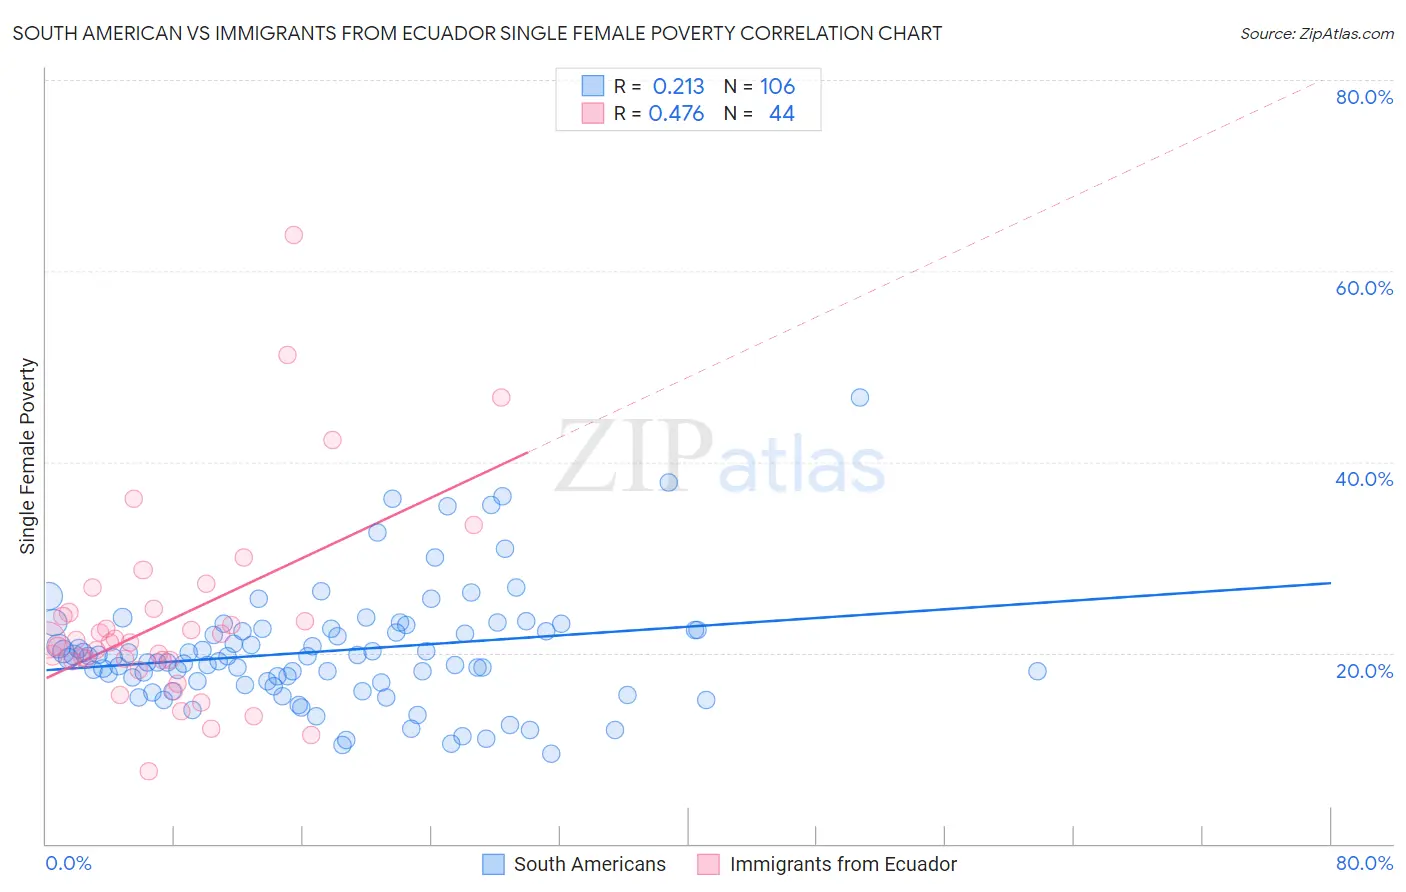
South American vs Immigrants from Ecuador Single Female Poverty Correlation Chart
The statistical analysis conducted on geographies consisting of 482,993,980 people shows a weak positive correlation between the proportion of South Americans and poverty level among single females in the United States with a correlation coefficient (R) of 0.213 and weighted average of 20.0%. Similarly, the statistical analysis conducted on geographies consisting of 268,226,949 people shows a moderate positive correlation between the proportion of Immigrants from Ecuador and poverty level among single females in the United States with a correlation coefficient (R) of 0.476 and weighted average of 22.0%, a difference of 10.0%.
Single Female Poverty Correlation Summary
| Measurement | South American | Immigrants from Ecuador |
| Minimum | 9.4% | 7.6% |
| Maximum | 46.7% | 63.8% |
| Range | 37.3% | 56.2% |
| Mean | 20.2% | 23.6% |
| Median | 19.5% | 21.2% |
| Interquartile 25% (IQ1) | 16.9% | 19.2% |
| Interquartile 75% (IQ3) | 22.4% | 24.4% |
| Interquartile Range (IQR) | 5.5% | 5.2% |
| Standard Deviation (Sample) | 6.2% | 10.6% |
| Standard Deviation (Population) | 6.2% | 10.5% |
Similar Demographics by Single Female Poverty
Demographics Similar to South Americans by Single Female Poverty
In terms of single female poverty, the demographic groups most similar to South Americans are Immigrants from Switzerland (20.0%, a difference of 0.030%), Immigrants from South America (20.0%, a difference of 0.060%), Immigrants from Afghanistan (20.0%, a difference of 0.10%), Immigrants from Ethiopia (20.0%, a difference of 0.10%), and Polish (20.0%, a difference of 0.17%).
| Demographics | Rating | Rank | Single Female Poverty |
| Immigrants | Zimbabwe | 95.9 /100 | #113 | Exceptional 20.0% |
| Immigrants | Colombia | 95.9 /100 | #114 | Exceptional 20.0% |
| Immigrants | Northern Africa | 95.8 /100 | #115 | Exceptional 20.0% |
| Immigrants | Kazakhstan | 95.7 /100 | #116 | Exceptional 20.0% |
| Poles | 95.6 /100 | #117 | Exceptional 20.0% |
| Immigrants | Afghanistan | 95.4 /100 | #118 | Exceptional 20.0% |
| Immigrants | Ethiopia | 95.4 /100 | #119 | Exceptional 20.0% |
| South Americans | 95.1 /100 | #120 | Exceptional 20.0% |
| Immigrants | Switzerland | 95.1 /100 | #121 | Exceptional 20.0% |
| Immigrants | South America | 95.0 /100 | #122 | Exceptional 20.0% |
| Brazilians | 94.4 /100 | #123 | Exceptional 20.1% |
| Immigrants | Chile | 94.3 /100 | #124 | Exceptional 20.1% |
| Immigrants | South Africa | 93.9 /100 | #125 | Exceptional 20.1% |
| Serbians | 93.3 /100 | #126 | Exceptional 20.1% |
| Mongolians | 93.2 /100 | #127 | Exceptional 20.2% |
Demographics Similar to Immigrants from Ecuador by Single Female Poverty
In terms of single female poverty, the demographic groups most similar to Immigrants from Ecuador are Vietnamese (22.0%, a difference of 0.070%), Dutch (22.0%, a difference of 0.16%), Spaniard (22.0%, a difference of 0.18%), Spanish (22.0%, a difference of 0.18%), and Immigrants from Thailand (22.0%, a difference of 0.28%).
| Demographics | Rating | Rank | Single Female Poverty |
| Tlingit-Haida | 5.4 /100 | #229 | Tragic 21.9% |
| Immigrants | Western Africa | 5.3 /100 | #230 | Tragic 22.0% |
| Welsh | 5.0 /100 | #231 | Tragic 22.0% |
| Immigrants | Thailand | 5.0 /100 | #232 | Tragic 22.0% |
| Spaniards | 4.7 /100 | #233 | Tragic 22.0% |
| Spanish | 4.7 /100 | #234 | Tragic 22.0% |
| Dutch | 4.6 /100 | #235 | Tragic 22.0% |
| Immigrants | Ecuador | 4.2 /100 | #236 | Tragic 22.0% |
| Vietnamese | 4.0 /100 | #237 | Tragic 22.0% |
| French Canadians | 2.8 /100 | #238 | Tragic 22.2% |
| Malaysians | 2.8 /100 | #239 | Tragic 22.2% |
| French | 2.3 /100 | #240 | Tragic 22.2% |
| Cape Verdeans | 2.1 /100 | #241 | Tragic 22.3% |
| Bermudans | 2.0 /100 | #242 | Tragic 22.3% |
| West Indians | 1.9 /100 | #243 | Tragic 22.3% |