South American vs Immigrants from Ecuador Ambulatory Disability
COMPARE
South American
Immigrants from Ecuador
Ambulatory Disability
Ambulatory Disability Comparison
South Americans
Immigrants from Ecuador
5.7%
AMBULATORY DISABILITY
99.0/ 100
METRIC RATING
85th/ 347
METRIC RANK
6.1%
AMBULATORY DISABILITY
53.8/ 100
METRIC RATING
170th/ 347
METRIC RANK
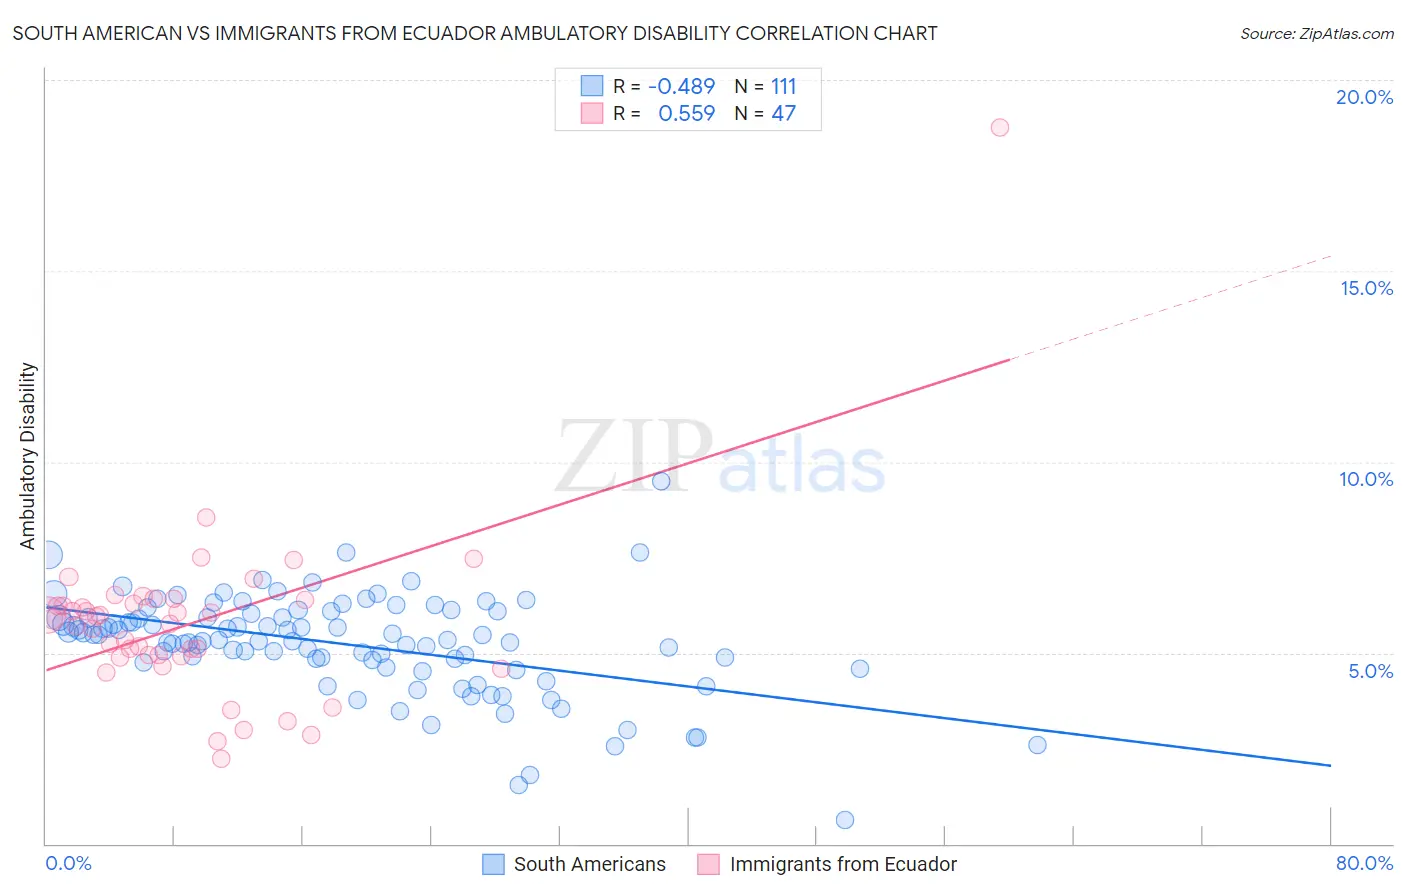
South American vs Immigrants from Ecuador Ambulatory Disability Correlation Chart
The statistical analysis conducted on geographies consisting of 493,855,959 people shows a moderate negative correlation between the proportion of South Americans and percentage of population with ambulatory disability in the United States with a correlation coefficient (R) of -0.489 and weighted average of 5.7%. Similarly, the statistical analysis conducted on geographies consisting of 270,935,255 people shows a substantial positive correlation between the proportion of Immigrants from Ecuador and percentage of population with ambulatory disability in the United States with a correlation coefficient (R) of 0.559 and weighted average of 6.1%, a difference of 6.3%.
Ambulatory Disability Correlation Summary
| Measurement | South American | Immigrants from Ecuador |
| Minimum | 0.63% | 2.2% |
| Maximum | 9.5% | 18.8% |
| Range | 8.9% | 16.5% |
| Mean | 5.2% | 5.8% |
| Median | 5.3% | 5.9% |
| Interquartile 25% (IQ1) | 4.7% | 4.9% |
| Interquartile 75% (IQ3) | 6.0% | 6.4% |
| Interquartile Range (IQR) | 1.3% | 1.5% |
| Standard Deviation (Sample) | 1.3% | 2.4% |
| Standard Deviation (Population) | 1.3% | 2.3% |
Similar Demographics by Ambulatory Disability
Demographics Similar to South Americans by Ambulatory Disability
In terms of ambulatory disability, the demographic groups most similar to South Americans are Latvian (5.7%, a difference of 0.030%), Immigrants from Chile (5.8%, a difference of 0.090%), Soviet Union (5.8%, a difference of 0.14%), Eastern European (5.7%, a difference of 0.24%), and Ugandan (5.7%, a difference of 0.24%).
| Demographics | Rating | Rank | Ambulatory Disability |
| Somalis | 99.2 /100 | #78 | Exceptional 5.7% |
| Chileans | 99.2 /100 | #79 | Exceptional 5.7% |
| Immigrants | Ireland | 99.2 /100 | #80 | Exceptional 5.7% |
| Immigrants | Jordan | 99.2 /100 | #81 | Exceptional 5.7% |
| Palestinians | 99.2 /100 | #82 | Exceptional 5.7% |
| Eastern Europeans | 99.2 /100 | #83 | Exceptional 5.7% |
| Ugandans | 99.2 /100 | #84 | Exceptional 5.7% |
| South Americans | 99.0 /100 | #85 | Exceptional 5.7% |
| Latvians | 99.0 /100 | #86 | Exceptional 5.7% |
| Immigrants | Chile | 98.9 /100 | #87 | Exceptional 5.8% |
| Soviet Union | 98.9 /100 | #88 | Exceptional 5.8% |
| Bhutanese | 98.8 /100 | #89 | Exceptional 5.8% |
| Australians | 98.8 /100 | #90 | Exceptional 5.8% |
| Immigrants | Sudan | 98.8 /100 | #91 | Exceptional 5.8% |
| Immigrants | Sierra Leone | 98.6 /100 | #92 | Exceptional 5.8% |
Demographics Similar to Immigrants from Ecuador by Ambulatory Disability
In terms of ambulatory disability, the demographic groups most similar to Immigrants from Ecuador are Moroccan (6.1%, a difference of 0.070%), Immigrants from Burma/Myanmar (6.1%, a difference of 0.090%), Croatian (6.1%, a difference of 0.14%), Immigrants from Canada (6.1%, a difference of 0.20%), and Immigrants from Southern Europe (6.1%, a difference of 0.23%).
| Demographics | Rating | Rank | Ambulatory Disability |
| Lebanese | 66.2 /100 | #163 | Good 6.1% |
| Basques | 63.7 /100 | #164 | Good 6.1% |
| Nicaraguans | 63.2 /100 | #165 | Good 6.1% |
| Iraqis | 62.8 /100 | #166 | Good 6.1% |
| Immigrants | Oceania | 60.7 /100 | #167 | Good 6.1% |
| Ecuadorians | 60.5 /100 | #168 | Good 6.1% |
| Immigrants | Southern Europe | 58.1 /100 | #169 | Average 6.1% |
| Immigrants | Ecuador | 53.8 /100 | #170 | Average 6.1% |
| Moroccans | 52.6 /100 | #171 | Average 6.1% |
| Immigrants | Burma/Myanmar | 52.2 /100 | #172 | Average 6.1% |
| Croatians | 51.2 /100 | #173 | Average 6.1% |
| Immigrants | Canada | 50.0 /100 | #174 | Average 6.1% |
| Vietnamese | 47.2 /100 | #175 | Average 6.1% |
| Immigrants | North America | 45.6 /100 | #176 | Average 6.1% |
| Immigrants | England | 45.4 /100 | #177 | Average 6.1% |