Cape Verdean vs Irish Receiving Food Stamps
COMPARE
Cape Verdean
Irish
Receiving Food Stamps
Receiving Food Stamps Comparison
Cape Verdeans
Irish
21.1%
RECEIVING FOOD STAMPS
0.0/ 100
METRIC RATING
337th/ 347
METRIC RANK
10.2%
RECEIVING FOOD STAMPS
97.9/ 100
METRIC RATING
92nd/ 347
METRIC RANK
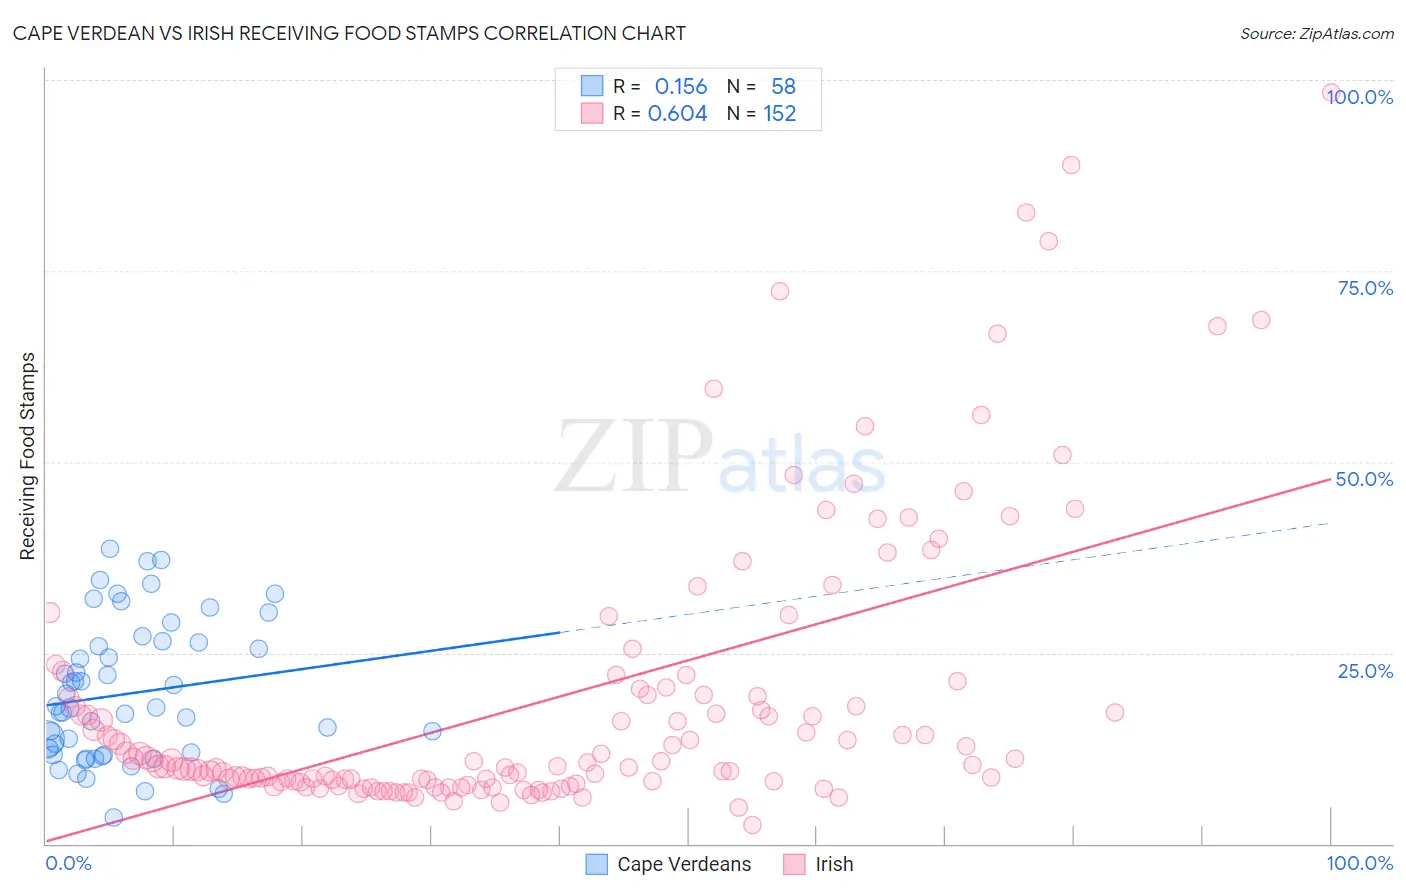
Cape Verdean vs Irish Receiving Food Stamps Correlation Chart
The statistical analysis conducted on geographies consisting of 107,485,738 people shows a poor positive correlation between the proportion of Cape Verdeans and percentage of population receiving government assistance and/or food stamps in the United States with a correlation coefficient (R) of 0.156 and weighted average of 21.1%. Similarly, the statistical analysis conducted on geographies consisting of 576,263,816 people shows a significant positive correlation between the proportion of Irish and percentage of population receiving government assistance and/or food stamps in the United States with a correlation coefficient (R) of 0.604 and weighted average of 10.2%, a difference of 107.4%.
Receiving Food Stamps Correlation Summary
| Measurement | Cape Verdean | Irish |
| Minimum | 3.4% | 2.5% |
| Maximum | 38.6% | 98.4% |
| Range | 35.2% | 95.9% |
| Mean | 19.6% | 18.8% |
| Median | 17.8% | 10.3% |
| Interquartile 25% (IQ1) | 11.7% | 8.1% |
| Interquartile 75% (IQ3) | 26.3% | 19.4% |
| Interquartile Range (IQR) | 14.6% | 11.3% |
| Standard Deviation (Sample) | 9.0% | 18.6% |
| Standard Deviation (Population) | 9.0% | 18.6% |
Similar Demographics by Receiving Food Stamps
Demographics Similar to Cape Verdeans by Receiving Food Stamps
In terms of receiving food stamps, the demographic groups most similar to Cape Verdeans are Navajo (21.1%, a difference of 0.060%), Immigrants from Cuba (20.8%, a difference of 1.2%), Dominican (21.4%, a difference of 1.4%), Yakama (21.4%, a difference of 1.7%), and Tohono O'odham (21.5%, a difference of 1.9%).
| Demographics | Rating | Rank | Receiving Food Stamps |
| Pima | 0.0 /100 | #330 | Tragic 19.0% |
| Immigrants | Caribbean | 0.0 /100 | #331 | Tragic 19.6% |
| Pueblo | 0.0 /100 | #332 | Tragic 19.9% |
| Inupiat | 0.0 /100 | #333 | Tragic 20.1% |
| Yuman | 0.0 /100 | #334 | Tragic 20.2% |
| Immigrants | Cuba | 0.0 /100 | #335 | Tragic 20.8% |
| Navajo | 0.0 /100 | #336 | Tragic 21.1% |
| Cape Verdeans | 0.0 /100 | #337 | Tragic 21.1% |
| Dominicans | 0.0 /100 | #338 | Tragic 21.4% |
| Yakama | 0.0 /100 | #339 | Tragic 21.4% |
| Tohono O'odham | 0.0 /100 | #340 | Tragic 21.5% |
| Hopi | 0.0 /100 | #341 | Tragic 21.6% |
| Immigrants | Yemen | 0.0 /100 | #342 | Tragic 21.6% |
| Immigrants | Dominican Republic | 0.0 /100 | #343 | Tragic 22.1% |
| Lumbee | 0.0 /100 | #344 | Tragic 22.9% |
Demographics Similar to Irish by Receiving Food Stamps
In terms of receiving food stamps, the demographic groups most similar to Irish are Jordanian (10.2%, a difference of 0.0%), Finnish (10.2%, a difference of 0.040%), Belgian (10.2%, a difference of 0.38%), Immigrants from France (10.1%, a difference of 0.89%), and Immigrants from Greece (10.3%, a difference of 0.91%).
| Demographics | Rating | Rank | Receiving Food Stamps |
| Immigrants | Romania | 98.5 /100 | #85 | Exceptional 10.0% |
| Immigrants | Norway | 98.4 /100 | #86 | Exceptional 10.0% |
| Egyptians | 98.4 /100 | #87 | Exceptional 10.0% |
| Immigrants | Kuwait | 98.4 /100 | #88 | Exceptional 10.0% |
| Immigrants | France | 98.3 /100 | #89 | Exceptional 10.1% |
| Finns | 97.9 /100 | #90 | Exceptional 10.2% |
| Jordanians | 97.9 /100 | #91 | Exceptional 10.2% |
| Irish | 97.9 /100 | #92 | Exceptional 10.2% |
| Belgians | 97.7 /100 | #93 | Exceptional 10.2% |
| Immigrants | Greece | 97.4 /100 | #94 | Exceptional 10.3% |
| Basques | 97.4 /100 | #95 | Exceptional 10.3% |
| Welsh | 97.3 /100 | #96 | Exceptional 10.3% |
| Czechoslovakians | 97.2 /100 | #97 | Exceptional 10.3% |
| Immigrants | Egypt | 97.1 /100 | #98 | Exceptional 10.3% |
| Serbians | 97.0 /100 | #99 | Exceptional 10.3% |