South American Indian vs Immigrants from Latvia Poverty
COMPARE
South American Indian
Immigrants from Latvia
Poverty
Poverty Comparison
South American Indians
Immigrants from Latvia
12.7%
POVERTY
23.3/ 100
METRIC RATING
192nd/ 347
METRIC RANK
11.5%
POVERTY
94.5/ 100
METRIC RATING
98th/ 347
METRIC RANK
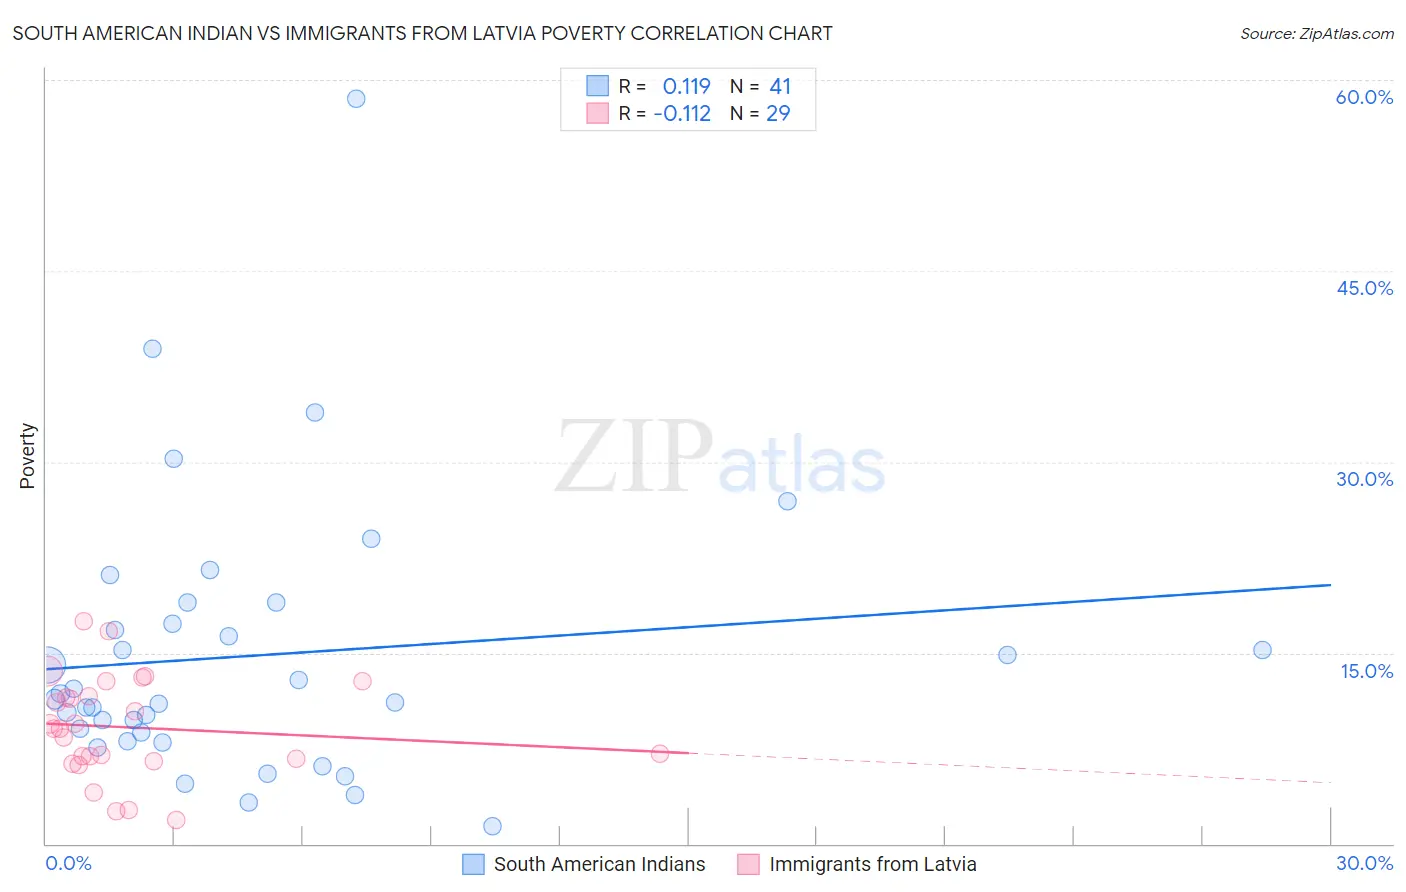
South American Indian vs Immigrants from Latvia Poverty Correlation Chart
The statistical analysis conducted on geographies consisting of 164,528,335 people shows a poor positive correlation between the proportion of South American Indians and poverty level in the United States with a correlation coefficient (R) of 0.119 and weighted average of 12.7%. Similarly, the statistical analysis conducted on geographies consisting of 113,731,697 people shows a poor negative correlation between the proportion of Immigrants from Latvia and poverty level in the United States with a correlation coefficient (R) of -0.112 and weighted average of 11.5%, a difference of 10.5%.
Poverty Correlation Summary
| Measurement | South American Indian | Immigrants from Latvia |
| Minimum | 1.4% | 1.8% |
| Maximum | 58.5% | 17.5% |
| Range | 57.1% | 15.6% |
| Mean | 14.8% | 9.1% |
| Median | 11.4% | 9.1% |
| Interquartile 25% (IQ1) | 8.4% | 6.6% |
| Interquartile 75% (IQ3) | 18.2% | 12.2% |
| Interquartile Range (IQR) | 9.8% | 5.6% |
| Standard Deviation (Sample) | 10.8% | 4.0% |
| Standard Deviation (Population) | 10.6% | 3.9% |
Similar Demographics by Poverty
Demographics Similar to South American Indians by Poverty
In terms of poverty, the demographic groups most similar to South American Indians are Delaware (12.7%, a difference of 0.25%), Arab (12.7%, a difference of 0.29%), Immigrants from Kuwait (12.7%, a difference of 0.33%), Iraqi (12.7%, a difference of 0.34%), and Immigrants from Lebanon (12.8%, a difference of 0.65%).
| Demographics | Rating | Rank | Poverty |
| Israelis | 36.4 /100 | #185 | Fair 12.5% |
| Immigrants | Sierra Leone | 36.3 /100 | #186 | Fair 12.5% |
| Hawaiians | 34.1 /100 | #187 | Fair 12.5% |
| Immigrants | Costa Rica | 33.3 /100 | #188 | Fair 12.5% |
| Aleuts | 33.2 /100 | #189 | Fair 12.5% |
| Immigrants | South America | 32.3 /100 | #190 | Fair 12.5% |
| Sierra Leoneans | 31.5 /100 | #191 | Fair 12.6% |
| South American Indians | 23.3 /100 | #192 | Fair 12.7% |
| Delaware | 21.4 /100 | #193 | Fair 12.7% |
| Arabs | 21.1 /100 | #194 | Fair 12.7% |
| Immigrants | Kuwait | 20.9 /100 | #195 | Fair 12.7% |
| Iraqis | 20.8 /100 | #196 | Fair 12.7% |
| Immigrants | Lebanon | 18.7 /100 | #197 | Poor 12.8% |
| Spanish | 18.7 /100 | #198 | Poor 12.8% |
| Immigrants | Kenya | 17.5 /100 | #199 | Poor 12.8% |
Demographics Similar to Immigrants from Latvia by Poverty
In terms of poverty, the demographic groups most similar to Immigrants from Latvia are Immigrants from Egypt (11.5%, a difference of 0.030%), Immigrants from South Africa (11.5%, a difference of 0.070%), Immigrants from Indonesia (11.5%, a difference of 0.14%), Paraguayan (11.4%, a difference of 0.19%), and Australian (11.4%, a difference of 0.19%).
| Demographics | Rating | Rank | Poverty |
| Finns | 95.2 /100 | #91 | Exceptional 11.4% |
| British | 95.0 /100 | #92 | Exceptional 11.4% |
| Romanians | 94.9 /100 | #93 | Exceptional 11.4% |
| Paraguayans | 94.9 /100 | #94 | Exceptional 11.4% |
| Australians | 94.9 /100 | #95 | Exceptional 11.4% |
| Immigrants | South Africa | 94.7 /100 | #96 | Exceptional 11.5% |
| Immigrants | Egypt | 94.6 /100 | #97 | Exceptional 11.5% |
| Immigrants | Latvia | 94.5 /100 | #98 | Exceptional 11.5% |
| Immigrants | Indonesia | 94.2 /100 | #99 | Exceptional 11.5% |
| Scottish | 94.0 /100 | #100 | Exceptional 11.5% |
| Slavs | 93.3 /100 | #101 | Exceptional 11.5% |
| Laotians | 92.4 /100 | #102 | Exceptional 11.6% |
| Okinawans | 92.4 /100 | #103 | Exceptional 11.6% |
| Native Hawaiians | 92.1 /100 | #104 | Exceptional 11.6% |
| Portuguese | 92.1 /100 | #105 | Exceptional 11.6% |