South African vs Dutch West Indian Female Poverty Among 25-34 Year Olds
COMPARE
South African
Dutch West Indian
Female Poverty Among 25-34 Year Olds
Female Poverty Among 25-34 Year Olds Comparison
South Africans
Dutch West Indians
13.0%
FEMALE POVERTY AMONG 25-34 YEAR OLDS
85.7/ 100
METRIC RATING
135th/ 347
METRIC RANK
18.4%
FEMALE POVERTY AMONG 25-34 YEAR OLDS
0.0/ 100
METRIC RATING
324th/ 347
METRIC RANK
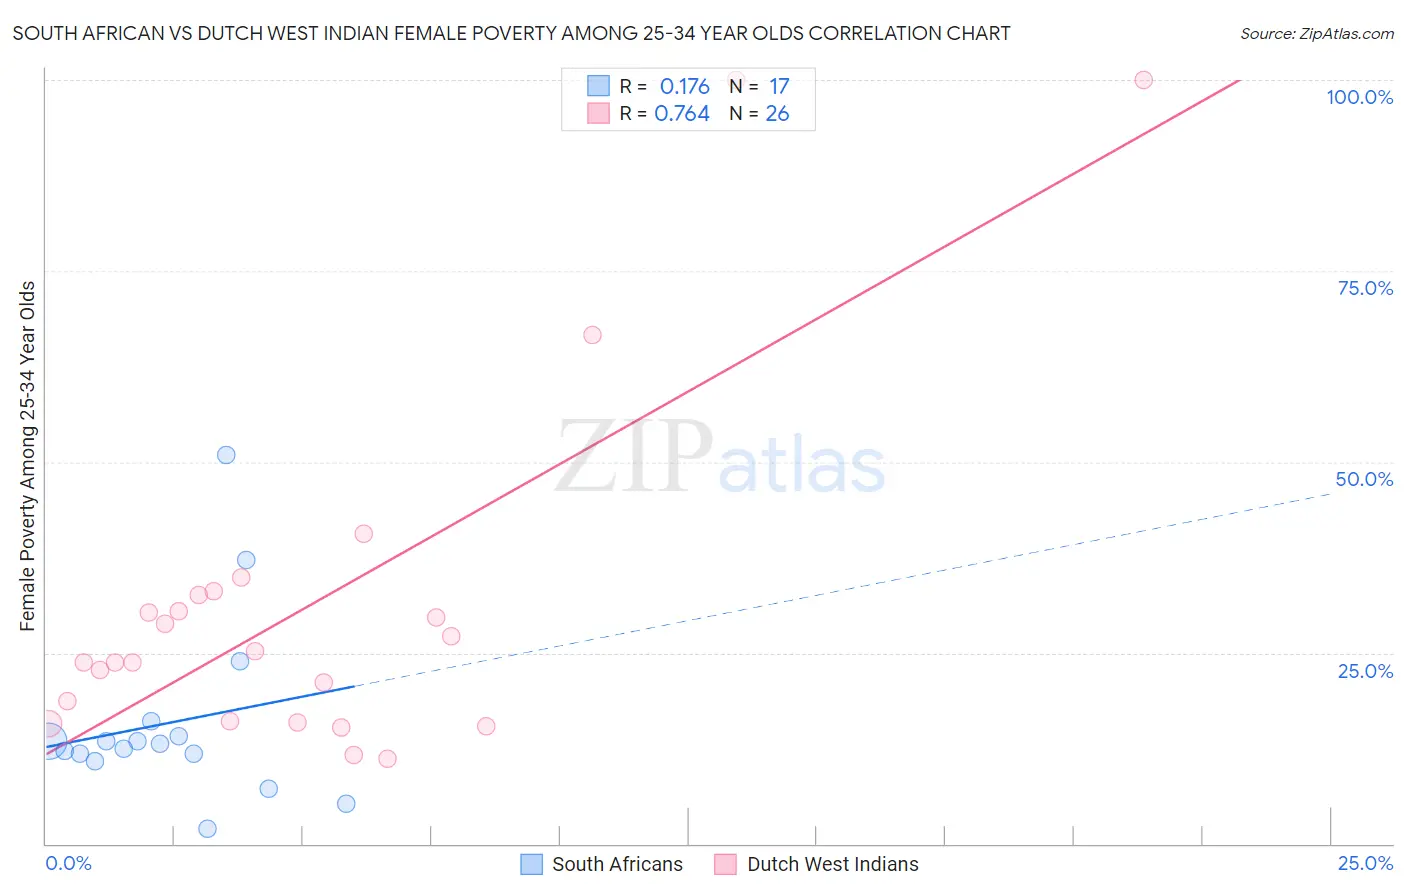
South African vs Dutch West Indian Female Poverty Among 25-34 Year Olds Correlation Chart
The statistical analysis conducted on geographies consisting of 180,794,089 people shows a poor positive correlation between the proportion of South Africans and poverty level among females between the ages 25 and 34 in the United States with a correlation coefficient (R) of 0.176 and weighted average of 13.0%. Similarly, the statistical analysis conducted on geographies consisting of 85,426,619 people shows a strong positive correlation between the proportion of Dutch West Indians and poverty level among females between the ages 25 and 34 in the United States with a correlation coefficient (R) of 0.764 and weighted average of 18.4%, a difference of 41.5%.
Female Poverty Among 25-34 Year Olds Correlation Summary
| Measurement | South African | Dutch West Indian |
| Minimum | 2.0% | 11.1% |
| Maximum | 51.0% | 100.0% |
| Range | 49.0% | 88.9% |
| Mean | 15.8% | 31.3% |
| Median | 13.2% | 24.5% |
| Interquartile 25% (IQ1) | 11.3% | 16.1% |
| Interquartile 75% (IQ3) | 15.1% | 32.6% |
| Interquartile Range (IQR) | 3.8% | 16.5% |
| Standard Deviation (Sample) | 11.8% | 23.1% |
| Standard Deviation (Population) | 11.5% | 22.7% |
Similar Demographics by Female Poverty Among 25-34 Year Olds
Demographics Similar to South Africans by Female Poverty Among 25-34 Year Olds
In terms of female poverty among 25-34 year olds, the demographic groups most similar to South Africans are Afghan (13.0%, a difference of 0.020%), Immigrants from England (13.0%, a difference of 0.020%), Immigrants from Chile (13.1%, a difference of 0.18%), Brazilian (13.1%, a difference of 0.20%), and Austrian (13.1%, a difference of 0.32%).
| Demographics | Rating | Rank | Female Poverty Among 25-34 Year Olds |
| Syrians | 90.2 /100 | #128 | Exceptional 12.9% |
| Immigrants | North America | 89.7 /100 | #129 | Excellent 12.9% |
| Immigrants | Uzbekistan | 89.6 /100 | #130 | Excellent 12.9% |
| Pakistanis | 88.4 /100 | #131 | Excellent 13.0% |
| Immigrants | Hungary | 88.3 /100 | #132 | Excellent 13.0% |
| Serbians | 87.6 /100 | #133 | Excellent 13.0% |
| Afghans | 85.8 /100 | #134 | Excellent 13.0% |
| South Africans | 85.7 /100 | #135 | Excellent 13.0% |
| Immigrants | England | 85.5 /100 | #136 | Excellent 13.0% |
| Immigrants | Chile | 84.6 /100 | #137 | Excellent 13.1% |
| Brazilians | 84.5 /100 | #138 | Excellent 13.1% |
| Austrians | 83.7 /100 | #139 | Excellent 13.1% |
| Immigrants | Iraq | 83.6 /100 | #140 | Excellent 13.1% |
| New Zealanders | 83.4 /100 | #141 | Excellent 13.1% |
| Scandinavians | 82.3 /100 | #142 | Excellent 13.1% |
Demographics Similar to Dutch West Indians by Female Poverty Among 25-34 Year Olds
In terms of female poverty among 25-34 year olds, the demographic groups most similar to Dutch West Indians are Inupiat (18.5%, a difference of 0.52%), Seminole (18.3%, a difference of 0.95%), Central American Indian (18.2%, a difference of 1.3%), Choctaw (18.1%, a difference of 2.1%), and Chippewa (18.0%, a difference of 2.4%).
| Demographics | Rating | Rank | Female Poverty Among 25-34 Year Olds |
| Arapaho | 0.0 /100 | #317 | Tragic 17.8% |
| Ute | 0.0 /100 | #318 | Tragic 17.9% |
| Menominee | 0.0 /100 | #319 | Tragic 18.0% |
| Chippewa | 0.0 /100 | #320 | Tragic 18.0% |
| Choctaw | 0.0 /100 | #321 | Tragic 18.1% |
| Central American Indians | 0.0 /100 | #322 | Tragic 18.2% |
| Seminole | 0.0 /100 | #323 | Tragic 18.3% |
| Dutch West Indians | 0.0 /100 | #324 | Tragic 18.4% |
| Inupiat | 0.0 /100 | #325 | Tragic 18.5% |
| Blacks/African Americans | 0.0 /100 | #326 | Tragic 18.9% |
| Cheyenne | 0.0 /100 | #327 | Tragic 19.1% |
| Alaskan Athabascans | 0.0 /100 | #328 | Tragic 19.1% |
| Creek | 0.0 /100 | #329 | Tragic 19.2% |
| Paiute | 0.0 /100 | #330 | Tragic 19.6% |
| Kiowa | 0.0 /100 | #331 | Tragic 19.7% |