South African vs Immigrants from Eastern Asia Female Poverty Among 25-34 Year Olds
COMPARE
South African
Immigrants from Eastern Asia
Female Poverty Among 25-34 Year Olds
Female Poverty Among 25-34 Year Olds Comparison
South Africans
Immigrants from Eastern Asia
13.0%
FEMALE POVERTY AMONG 25-34 YEAR OLDS
85.7/ 100
METRIC RATING
135th/ 347
METRIC RANK
11.2%
FEMALE POVERTY AMONG 25-34 YEAR OLDS
100.0/ 100
METRIC RATING
18th/ 347
METRIC RANK
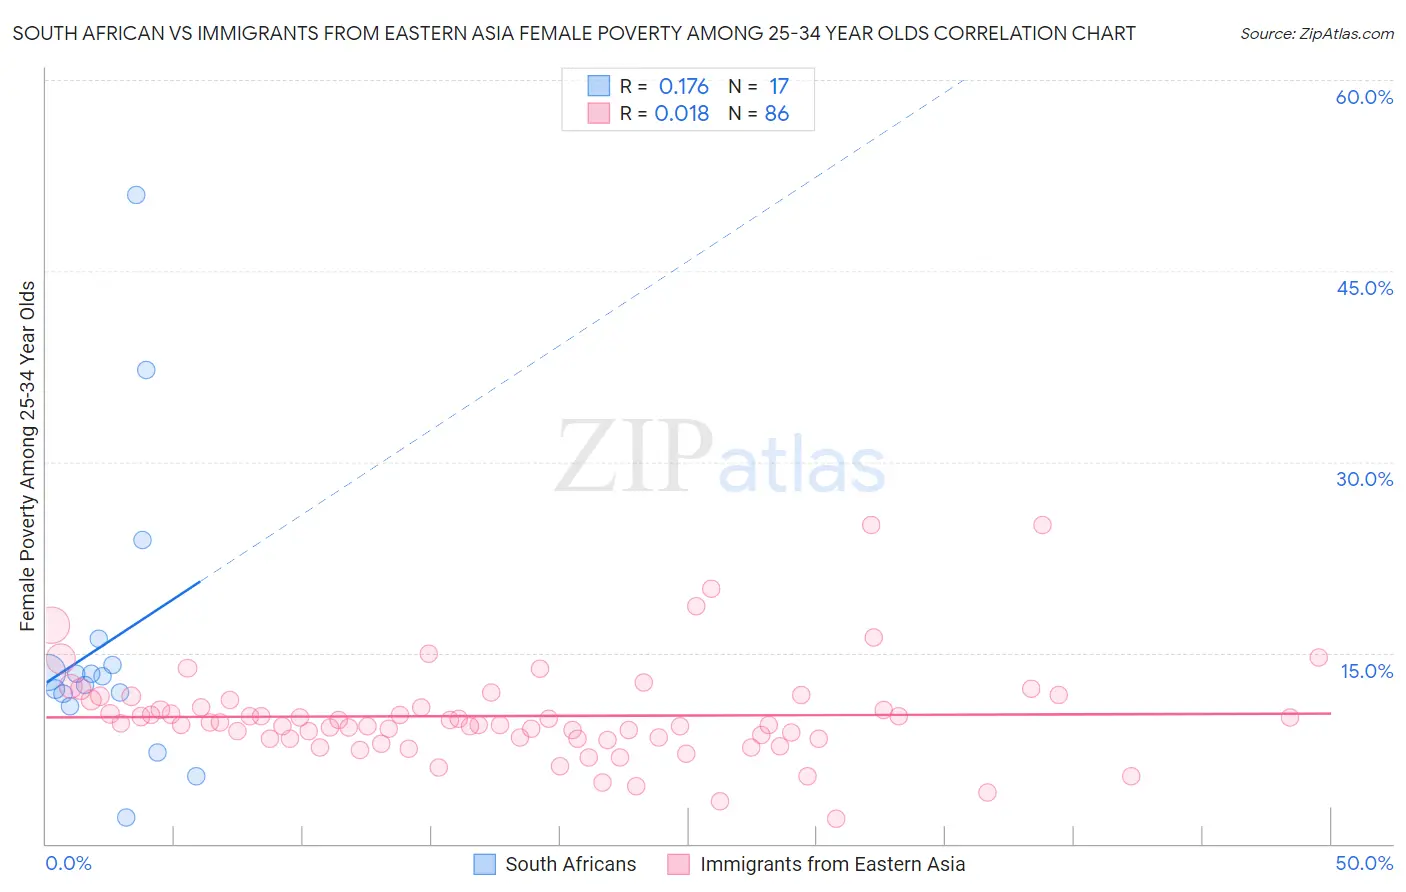
South African vs Immigrants from Eastern Asia Female Poverty Among 25-34 Year Olds Correlation Chart
The statistical analysis conducted on geographies consisting of 180,794,089 people shows a poor positive correlation between the proportion of South Africans and poverty level among females between the ages 25 and 34 in the United States with a correlation coefficient (R) of 0.176 and weighted average of 13.0%. Similarly, the statistical analysis conducted on geographies consisting of 486,963,543 people shows no correlation between the proportion of Immigrants from Eastern Asia and poverty level among females between the ages 25 and 34 in the United States with a correlation coefficient (R) of 0.018 and weighted average of 11.2%, a difference of 16.2%.
Female Poverty Among 25-34 Year Olds Correlation Summary
| Measurement | South African | Immigrants from Eastern Asia |
| Minimum | 2.0% | 1.9% |
| Maximum | 51.0% | 25.0% |
| Range | 49.0% | 23.1% |
| Mean | 15.8% | 10.0% |
| Median | 13.2% | 9.4% |
| Interquartile 25% (IQ1) | 11.3% | 8.2% |
| Interquartile 75% (IQ3) | 15.1% | 11.3% |
| Interquartile Range (IQR) | 3.8% | 3.0% |
| Standard Deviation (Sample) | 11.8% | 3.8% |
| Standard Deviation (Population) | 11.5% | 3.8% |
Similar Demographics by Female Poverty Among 25-34 Year Olds
Demographics Similar to South Africans by Female Poverty Among 25-34 Year Olds
In terms of female poverty among 25-34 year olds, the demographic groups most similar to South Africans are Afghan (13.0%, a difference of 0.020%), Immigrants from England (13.0%, a difference of 0.020%), Immigrants from Chile (13.1%, a difference of 0.18%), Brazilian (13.1%, a difference of 0.20%), and Austrian (13.1%, a difference of 0.32%).
| Demographics | Rating | Rank | Female Poverty Among 25-34 Year Olds |
| Syrians | 90.2 /100 | #128 | Exceptional 12.9% |
| Immigrants | North America | 89.7 /100 | #129 | Excellent 12.9% |
| Immigrants | Uzbekistan | 89.6 /100 | #130 | Excellent 12.9% |
| Pakistanis | 88.4 /100 | #131 | Excellent 13.0% |
| Immigrants | Hungary | 88.3 /100 | #132 | Excellent 13.0% |
| Serbians | 87.6 /100 | #133 | Excellent 13.0% |
| Afghans | 85.8 /100 | #134 | Excellent 13.0% |
| South Africans | 85.7 /100 | #135 | Excellent 13.0% |
| Immigrants | England | 85.5 /100 | #136 | Excellent 13.0% |
| Immigrants | Chile | 84.6 /100 | #137 | Excellent 13.1% |
| Brazilians | 84.5 /100 | #138 | Excellent 13.1% |
| Austrians | 83.7 /100 | #139 | Excellent 13.1% |
| Immigrants | Iraq | 83.6 /100 | #140 | Excellent 13.1% |
| New Zealanders | 83.4 /100 | #141 | Excellent 13.1% |
| Scandinavians | 82.3 /100 | #142 | Excellent 13.1% |
Demographics Similar to Immigrants from Eastern Asia by Female Poverty Among 25-34 Year Olds
In terms of female poverty among 25-34 year olds, the demographic groups most similar to Immigrants from Eastern Asia are Immigrants from China (11.2%, a difference of 0.11%), Iranian (11.2%, a difference of 0.14%), Immigrants from Bolivia (11.2%, a difference of 0.18%), Assyrian/Chaldean/Syriac (11.2%, a difference of 0.22%), and Burmese (11.2%, a difference of 0.33%).
| Demographics | Rating | Rank | Female Poverty Among 25-34 Year Olds |
| Immigrants | Korea | 100.0 /100 | #11 | Exceptional 11.1% |
| Immigrants | Ireland | 100.0 /100 | #12 | Exceptional 11.2% |
| Burmese | 100.0 /100 | #13 | Exceptional 11.2% |
| Indians (Asian) | 100.0 /100 | #14 | Exceptional 11.2% |
| Assyrians/Chaldeans/Syriacs | 100.0 /100 | #15 | Exceptional 11.2% |
| Immigrants | Bolivia | 100.0 /100 | #16 | Exceptional 11.2% |
| Immigrants | China | 100.0 /100 | #17 | Exceptional 11.2% |
| Immigrants | Eastern Asia | 100.0 /100 | #18 | Exceptional 11.2% |
| Iranians | 100.0 /100 | #19 | Exceptional 11.2% |
| Okinawans | 100.0 /100 | #20 | Exceptional 11.3% |
| Turks | 100.0 /100 | #21 | Exceptional 11.4% |
| Asians | 99.9 /100 | #22 | Exceptional 11.4% |
| Bolivians | 99.9 /100 | #23 | Exceptional 11.4% |
| Maltese | 99.9 /100 | #24 | Exceptional 11.4% |
| Bhutanese | 99.9 /100 | #25 | Exceptional 11.4% |