Ethiopian vs Dutch West Indian Female Poverty Among 25-34 Year Olds
COMPARE
Ethiopian
Dutch West Indian
Female Poverty Among 25-34 Year Olds
Female Poverty Among 25-34 Year Olds Comparison
Ethiopians
Dutch West Indians
12.4%
FEMALE POVERTY AMONG 25-34 YEAR OLDS
98.0/ 100
METRIC RATING
82nd/ 347
METRIC RANK
18.4%
FEMALE POVERTY AMONG 25-34 YEAR OLDS
0.0/ 100
METRIC RATING
324th/ 347
METRIC RANK
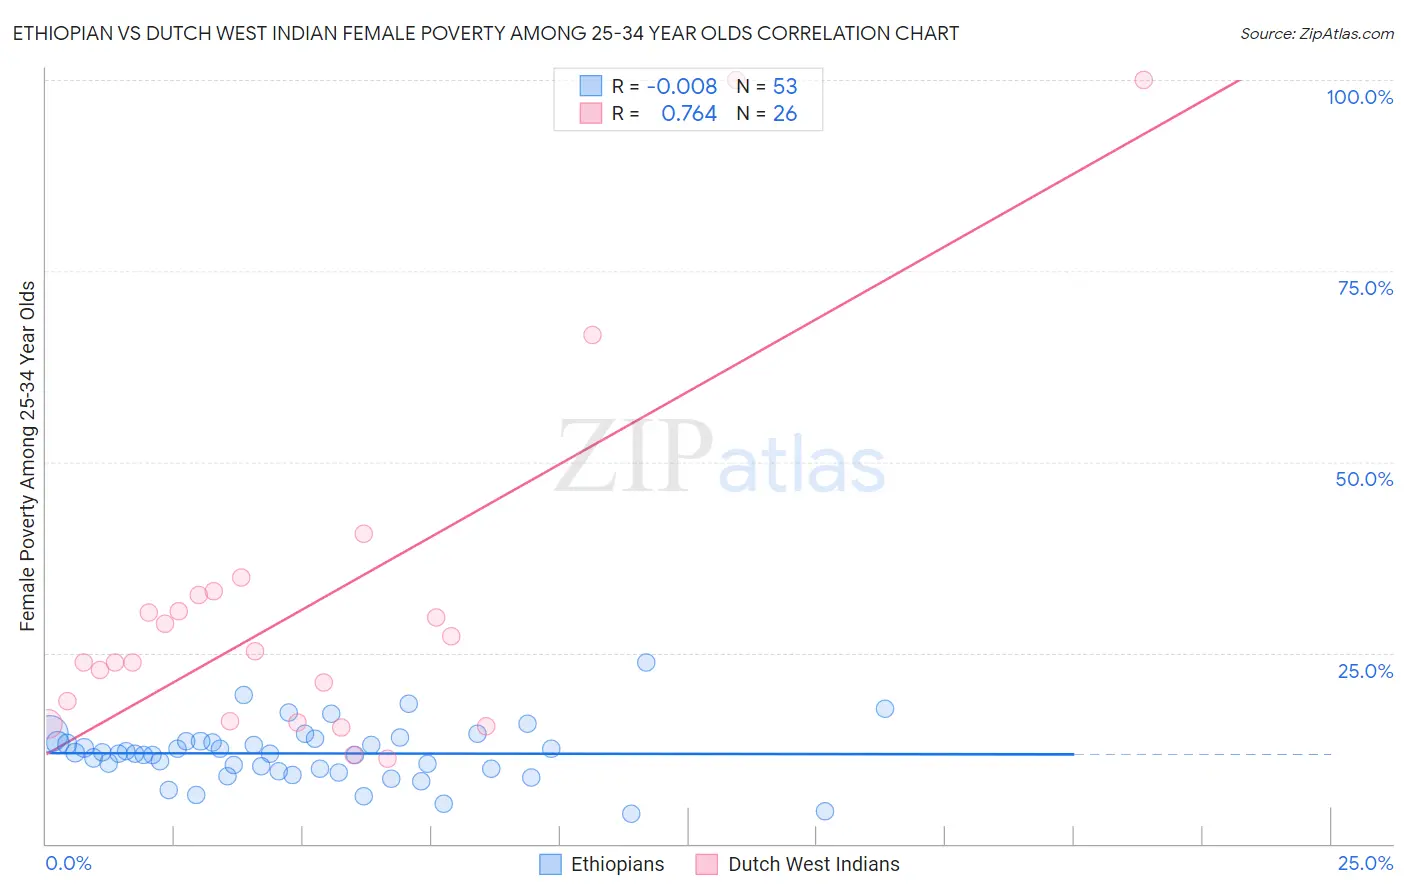
Ethiopian vs Dutch West Indian Female Poverty Among 25-34 Year Olds Correlation Chart
The statistical analysis conducted on geographies consisting of 221,750,930 people shows no correlation between the proportion of Ethiopians and poverty level among females between the ages 25 and 34 in the United States with a correlation coefficient (R) of -0.008 and weighted average of 12.4%. Similarly, the statistical analysis conducted on geographies consisting of 85,426,619 people shows a strong positive correlation between the proportion of Dutch West Indians and poverty level among females between the ages 25 and 34 in the United States with a correlation coefficient (R) of 0.764 and weighted average of 18.4%, a difference of 48.3%.
Female Poverty Among 25-34 Year Olds Correlation Summary
| Measurement | Ethiopian | Dutch West Indian |
| Minimum | 4.0% | 11.1% |
| Maximum | 23.7% | 100.0% |
| Range | 19.7% | 88.9% |
| Mean | 11.8% | 31.3% |
| Median | 11.9% | 24.5% |
| Interquartile 25% (IQ1) | 9.7% | 16.1% |
| Interquartile 75% (IQ3) | 13.4% | 32.6% |
| Interquartile Range (IQR) | 3.7% | 16.5% |
| Standard Deviation (Sample) | 3.7% | 23.1% |
| Standard Deviation (Population) | 3.7% | 22.7% |
Similar Demographics by Female Poverty Among 25-34 Year Olds
Demographics Similar to Ethiopians by Female Poverty Among 25-34 Year Olds
In terms of female poverty among 25-34 year olds, the demographic groups most similar to Ethiopians are Immigrants from Kazakhstan (12.4%, a difference of 0.080%), Immigrants from Malaysia (12.4%, a difference of 0.32%), Albanian (12.5%, a difference of 0.32%), Immigrants from Latvia (12.5%, a difference of 0.38%), and Immigrants from South Eastern Asia (12.5%, a difference of 0.49%).
| Demographics | Rating | Rank | Female Poverty Among 25-34 Year Olds |
| Estonians | 98.9 /100 | #75 | Exceptional 12.3% |
| Greeks | 98.9 /100 | #76 | Exceptional 12.3% |
| Immigrants | Italy | 98.8 /100 | #77 | Exceptional 12.3% |
| Immigrants | Ukraine | 98.6 /100 | #78 | Exceptional 12.3% |
| Immigrants | Jordan | 98.5 /100 | #79 | Exceptional 12.4% |
| Immigrants | Malaysia | 98.3 /100 | #80 | Exceptional 12.4% |
| Immigrants | Kazakhstan | 98.1 /100 | #81 | Exceptional 12.4% |
| Ethiopians | 98.0 /100 | #82 | Exceptional 12.4% |
| Albanians | 97.7 /100 | #83 | Exceptional 12.5% |
| Immigrants | Latvia | 97.7 /100 | #84 | Exceptional 12.5% |
| Immigrants | South Eastern Asia | 97.6 /100 | #85 | Exceptional 12.5% |
| Croatians | 97.5 /100 | #86 | Exceptional 12.5% |
| Argentineans | 97.5 /100 | #87 | Exceptional 12.5% |
| Immigrants | Austria | 97.4 /100 | #88 | Exceptional 12.5% |
| Italians | 97.2 /100 | #89 | Exceptional 12.5% |
Demographics Similar to Dutch West Indians by Female Poverty Among 25-34 Year Olds
In terms of female poverty among 25-34 year olds, the demographic groups most similar to Dutch West Indians are Inupiat (18.5%, a difference of 0.52%), Seminole (18.3%, a difference of 0.95%), Central American Indian (18.2%, a difference of 1.3%), Choctaw (18.1%, a difference of 2.1%), and Chippewa (18.0%, a difference of 2.4%).
| Demographics | Rating | Rank | Female Poverty Among 25-34 Year Olds |
| Arapaho | 0.0 /100 | #317 | Tragic 17.8% |
| Ute | 0.0 /100 | #318 | Tragic 17.9% |
| Menominee | 0.0 /100 | #319 | Tragic 18.0% |
| Chippewa | 0.0 /100 | #320 | Tragic 18.0% |
| Choctaw | 0.0 /100 | #321 | Tragic 18.1% |
| Central American Indians | 0.0 /100 | #322 | Tragic 18.2% |
| Seminole | 0.0 /100 | #323 | Tragic 18.3% |
| Dutch West Indians | 0.0 /100 | #324 | Tragic 18.4% |
| Inupiat | 0.0 /100 | #325 | Tragic 18.5% |
| Blacks/African Americans | 0.0 /100 | #326 | Tragic 18.9% |
| Cheyenne | 0.0 /100 | #327 | Tragic 19.1% |
| Alaskan Athabascans | 0.0 /100 | #328 | Tragic 19.1% |
| Creek | 0.0 /100 | #329 | Tragic 19.2% |
| Paiute | 0.0 /100 | #330 | Tragic 19.6% |
| Kiowa | 0.0 /100 | #331 | Tragic 19.7% |