South African vs Immigrants from Venezuela Female Poverty Among 25-34 Year Olds
COMPARE
South African
Immigrants from Venezuela
Female Poverty Among 25-34 Year Olds
Female Poverty Among 25-34 Year Olds Comparison
South Africans
Immigrants from Venezuela
13.0%
FEMALE POVERTY AMONG 25-34 YEAR OLDS
85.7/ 100
METRIC RATING
135th/ 347
METRIC RANK
13.6%
FEMALE POVERTY AMONG 25-34 YEAR OLDS
40.7/ 100
METRIC RATING
182nd/ 347
METRIC RANK
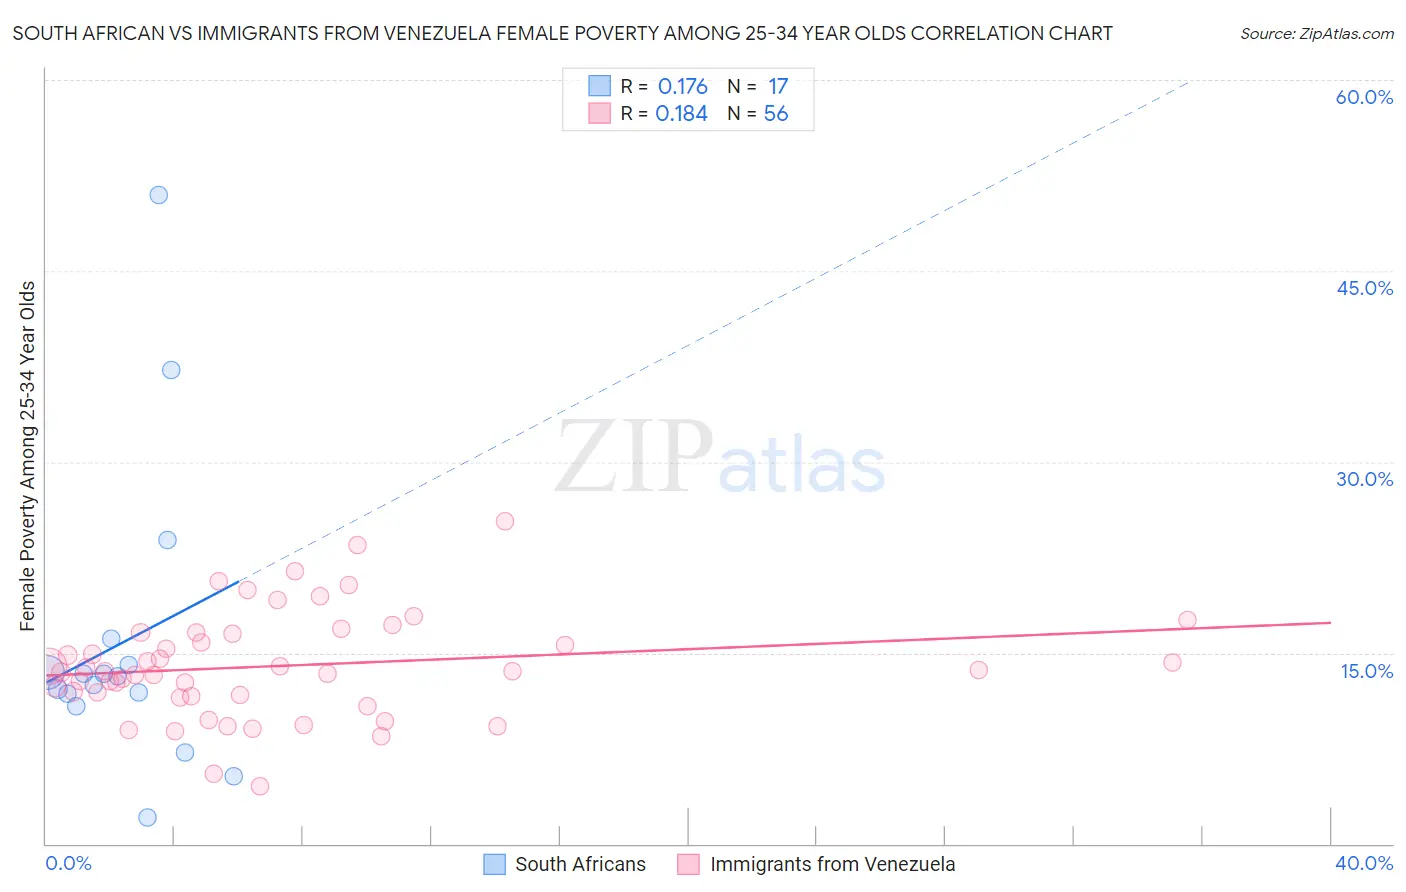
South African vs Immigrants from Venezuela Female Poverty Among 25-34 Year Olds Correlation Chart
The statistical analysis conducted on geographies consisting of 180,794,089 people shows a poor positive correlation between the proportion of South Africans and poverty level among females between the ages 25 and 34 in the United States with a correlation coefficient (R) of 0.176 and weighted average of 13.0%. Similarly, the statistical analysis conducted on geographies consisting of 285,242,429 people shows a poor positive correlation between the proportion of Immigrants from Venezuela and poverty level among females between the ages 25 and 34 in the United States with a correlation coefficient (R) of 0.184 and weighted average of 13.6%, a difference of 4.7%.
Female Poverty Among 25-34 Year Olds Correlation Summary
| Measurement | South African | Immigrants from Venezuela |
| Minimum | 2.0% | 4.5% |
| Maximum | 51.0% | 25.3% |
| Range | 49.0% | 20.8% |
| Mean | 15.8% | 14.0% |
| Median | 13.2% | 13.5% |
| Interquartile 25% (IQ1) | 11.3% | 11.6% |
| Interquartile 75% (IQ3) | 15.1% | 16.6% |
| Interquartile Range (IQR) | 3.8% | 4.9% |
| Standard Deviation (Sample) | 11.8% | 4.2% |
| Standard Deviation (Population) | 11.5% | 4.1% |
Similar Demographics by Female Poverty Among 25-34 Year Olds
Demographics Similar to South Africans by Female Poverty Among 25-34 Year Olds
In terms of female poverty among 25-34 year olds, the demographic groups most similar to South Africans are Afghan (13.0%, a difference of 0.020%), Immigrants from England (13.0%, a difference of 0.020%), Immigrants from Chile (13.1%, a difference of 0.18%), Brazilian (13.1%, a difference of 0.20%), and Austrian (13.1%, a difference of 0.32%).
| Demographics | Rating | Rank | Female Poverty Among 25-34 Year Olds |
| Syrians | 90.2 /100 | #128 | Exceptional 12.9% |
| Immigrants | North America | 89.7 /100 | #129 | Excellent 12.9% |
| Immigrants | Uzbekistan | 89.6 /100 | #130 | Excellent 12.9% |
| Pakistanis | 88.4 /100 | #131 | Excellent 13.0% |
| Immigrants | Hungary | 88.3 /100 | #132 | Excellent 13.0% |
| Serbians | 87.6 /100 | #133 | Excellent 13.0% |
| Afghans | 85.8 /100 | #134 | Excellent 13.0% |
| South Africans | 85.7 /100 | #135 | Excellent 13.0% |
| Immigrants | England | 85.5 /100 | #136 | Excellent 13.0% |
| Immigrants | Chile | 84.6 /100 | #137 | Excellent 13.1% |
| Brazilians | 84.5 /100 | #138 | Excellent 13.1% |
| Austrians | 83.7 /100 | #139 | Excellent 13.1% |
| Immigrants | Iraq | 83.6 /100 | #140 | Excellent 13.1% |
| New Zealanders | 83.4 /100 | #141 | Excellent 13.1% |
| Scandinavians | 82.3 /100 | #142 | Excellent 13.1% |
Demographics Similar to Immigrants from Venezuela by Female Poverty Among 25-34 Year Olds
In terms of female poverty among 25-34 year olds, the demographic groups most similar to Immigrants from Venezuela are Portuguese (13.6%, a difference of 0.030%), German (13.6%, a difference of 0.070%), Guamanian/Chamorro (13.6%, a difference of 0.070%), Immigrants from Eastern Africa (13.6%, a difference of 0.24%), and Canadian (13.6%, a difference of 0.30%).
| Demographics | Rating | Rank | Female Poverty Among 25-34 Year Olds |
| Bermudans | 46.8 /100 | #175 | Average 13.6% |
| Yugoslavians | 45.0 /100 | #176 | Average 13.6% |
| Venezuelans | 44.6 /100 | #177 | Average 13.6% |
| Canadians | 44.3 /100 | #178 | Average 13.6% |
| Immigrants | Eastern Africa | 43.6 /100 | #179 | Average 13.6% |
| Germans | 41.6 /100 | #180 | Average 13.6% |
| Guamanians/Chamorros | 41.5 /100 | #181 | Average 13.6% |
| Immigrants | Venezuela | 40.7 /100 | #182 | Average 13.6% |
| Portuguese | 40.3 /100 | #183 | Average 13.6% |
| Czechoslovakians | 36.8 /100 | #184 | Fair 13.7% |
| Irish | 35.3 /100 | #185 | Fair 13.7% |
| Immigrants | Uruguay | 34.1 /100 | #186 | Fair 13.7% |
| Slovaks | 34.1 /100 | #187 | Fair 13.7% |
| Immigrants | Eritrea | 32.7 /100 | #188 | Fair 13.7% |
| Finns | 32.5 /100 | #189 | Fair 13.7% |