Slavic vs Immigrants from Caribbean Female Poverty Among 25-34 Year Olds
COMPARE
Slavic
Immigrants from Caribbean
Female Poverty Among 25-34 Year Olds
Female Poverty Among 25-34 Year Olds Comparison
Slavs
Immigrants from Caribbean
13.2%
FEMALE POVERTY AMONG 25-34 YEAR OLDS
75.7/ 100
METRIC RATING
152nd/ 347
METRIC RANK
15.7%
FEMALE POVERTY AMONG 25-34 YEAR OLDS
0.0/ 100
METRIC RATING
274th/ 347
METRIC RANK
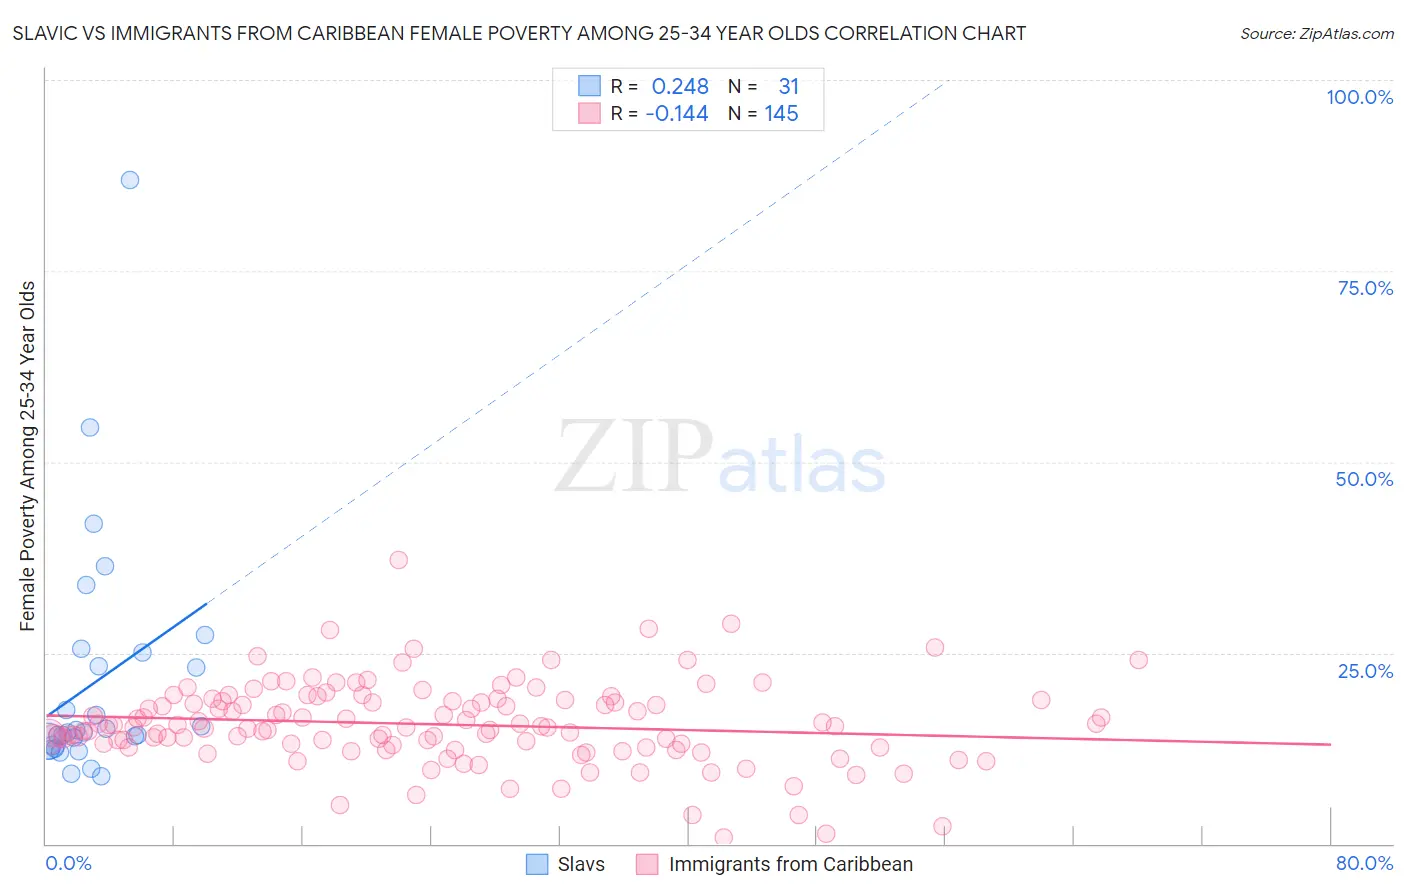
Slavic vs Immigrants from Caribbean Female Poverty Among 25-34 Year Olds Correlation Chart
The statistical analysis conducted on geographies consisting of 266,820,007 people shows a weak positive correlation between the proportion of Slavs and poverty level among females between the ages 25 and 34 in the United States with a correlation coefficient (R) of 0.248 and weighted average of 13.2%. Similarly, the statistical analysis conducted on geographies consisting of 441,382,759 people shows a poor negative correlation between the proportion of Immigrants from Caribbean and poverty level among females between the ages 25 and 34 in the United States with a correlation coefficient (R) of -0.144 and weighted average of 15.7%, a difference of 18.9%.
Female Poverty Among 25-34 Year Olds Correlation Summary
| Measurement | Slavic | Immigrants from Caribbean |
| Minimum | 8.9% | 0.81% |
| Maximum | 87.0% | 37.1% |
| Range | 78.1% | 36.3% |
| Mean | 21.3% | 15.6% |
| Median | 14.5% | 15.2% |
| Interquartile 25% (IQ1) | 12.9% | 12.8% |
| Interquartile 75% (IQ3) | 25.0% | 18.7% |
| Interquartile Range (IQR) | 12.1% | 5.9% |
| Standard Deviation (Sample) | 16.0% | 5.4% |
| Standard Deviation (Population) | 15.8% | 5.3% |
Similar Demographics by Female Poverty Among 25-34 Year Olds
Demographics Similar to Slavs by Female Poverty Among 25-34 Year Olds
In terms of female poverty among 25-34 year olds, the demographic groups most similar to Slavs are Costa Rican (13.2%, a difference of 0.010%), Iraqi (13.2%, a difference of 0.040%), Sierra Leonean (13.2%, a difference of 0.060%), European (13.2%, a difference of 0.13%), and Lebanese (13.2%, a difference of 0.13%).
| Demographics | Rating | Rank | Female Poverty Among 25-34 Year Olds |
| Colombians | 77.2 /100 | #145 | Good 13.2% |
| South Americans | 76.9 /100 | #146 | Good 13.2% |
| Europeans | 76.8 /100 | #147 | Good 13.2% |
| Lebanese | 76.8 /100 | #148 | Good 13.2% |
| Sierra Leoneans | 76.3 /100 | #149 | Good 13.2% |
| Iraqis | 76.0 /100 | #150 | Good 13.2% |
| Costa Ricans | 75.8 /100 | #151 | Good 13.2% |
| Slavs | 75.7 /100 | #152 | Good 13.2% |
| Northern Europeans | 73.7 /100 | #153 | Good 13.2% |
| Arabs | 73.5 /100 | #154 | Good 13.2% |
| Immigrants | Sierra Leone | 72.9 /100 | #155 | Good 13.3% |
| Immigrants | Cameroon | 72.0 /100 | #156 | Good 13.3% |
| Immigrants | Western Europe | 70.3 /100 | #157 | Good 13.3% |
| Immigrants | Colombia | 69.2 /100 | #158 | Good 13.3% |
| Uruguayans | 66.9 /100 | #159 | Good 13.3% |
Demographics Similar to Immigrants from Caribbean by Female Poverty Among 25-34 Year Olds
In terms of female poverty among 25-34 year olds, the demographic groups most similar to Immigrants from Caribbean are Immigrants from the Azores (15.8%, a difference of 0.35%), Nonimmigrants (15.6%, a difference of 0.49%), Senegalese (15.6%, a difference of 0.60%), Cree (15.6%, a difference of 0.66%), and British West Indian (15.6%, a difference of 0.67%).
| Demographics | Rating | Rank | Female Poverty Among 25-34 Year Olds |
| Central Americans | 0.1 /100 | #267 | Tragic 15.5% |
| Immigrants | Senegal | 0.1 /100 | #268 | Tragic 15.6% |
| Sub-Saharan Africans | 0.1 /100 | #269 | Tragic 15.6% |
| British West Indians | 0.1 /100 | #270 | Tragic 15.6% |
| Cree | 0.1 /100 | #271 | Tragic 15.6% |
| Senegalese | 0.1 /100 | #272 | Tragic 15.6% |
| Immigrants | Nonimmigrants | 0.1 /100 | #273 | Tragic 15.6% |
| Immigrants | Caribbean | 0.0 /100 | #274 | Tragic 15.7% |
| Immigrants | Azores | 0.0 /100 | #275 | Tragic 15.8% |
| Immigrants | Zaire | 0.0 /100 | #276 | Tragic 15.8% |
| Immigrants | Micronesia | 0.0 /100 | #277 | Tragic 15.8% |
| French American Indians | 0.0 /100 | #278 | Tragic 15.9% |
| Fijians | 0.0 /100 | #279 | Tragic 15.9% |
| Bangladeshis | 0.0 /100 | #280 | Tragic 15.9% |
| Immigrants | Latin America | 0.0 /100 | #281 | Tragic 16.0% |