Slavic vs Delaware Child Poverty Among Girls Under 16
COMPARE
Slavic
Delaware
Child Poverty Among Girls Under 16
Child Poverty Among Girls Under 16 Comparison
Slavs
Delaware
15.7%
CHILD POVERTY AMONG GIRLS UNDER 16
83.1/ 100
METRIC RATING
147th/ 347
METRIC RANK
17.4%
CHILD POVERTY AMONG GIRLS UNDER 16
11.5/ 100
METRIC RATING
206th/ 347
METRIC RANK
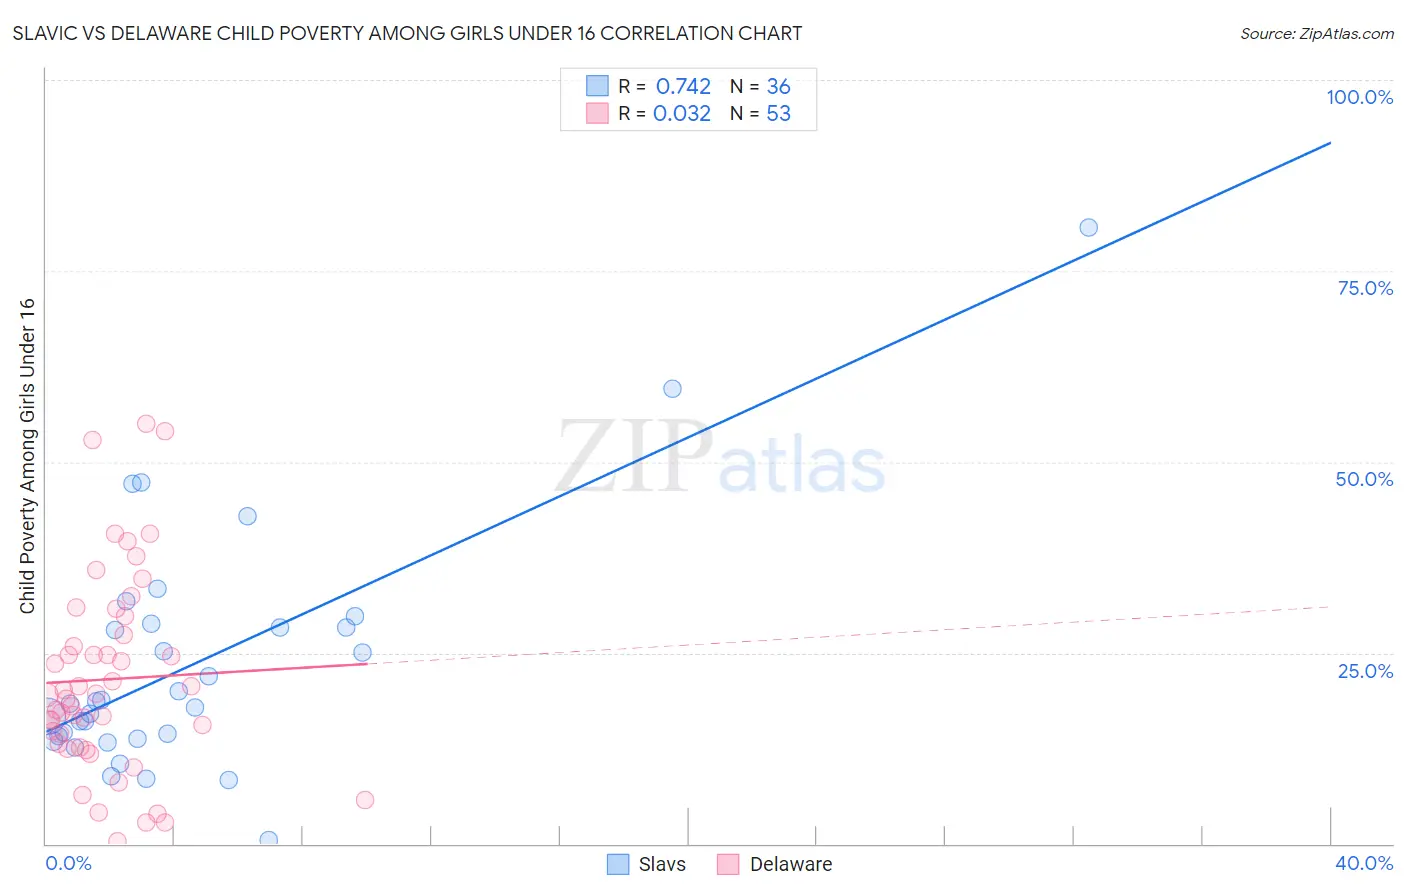
Slavic vs Delaware Child Poverty Among Girls Under 16 Correlation Chart
The statistical analysis conducted on geographies consisting of 266,780,772 people shows a strong positive correlation between the proportion of Slavs and poverty level among girls under the age of 16 in the United States with a correlation coefficient (R) of 0.742 and weighted average of 15.7%. Similarly, the statistical analysis conducted on geographies consisting of 95,689,201 people shows no correlation between the proportion of Delaware and poverty level among girls under the age of 16 in the United States with a correlation coefficient (R) of 0.032 and weighted average of 17.4%, a difference of 10.9%.
Child Poverty Among Girls Under 16 Correlation Summary
| Measurement | Slavic | Delaware |
| Minimum | 0.51% | 0.32% |
| Maximum | 80.7% | 55.0% |
| Range | 80.2% | 54.7% |
| Mean | 23.6% | 21.5% |
| Median | 18.5% | 19.5% |
| Interquartile 25% (IQ1) | 14.0% | 12.8% |
| Interquartile 75% (IQ3) | 28.6% | 28.5% |
| Interquartile Range (IQR) | 14.6% | 15.7% |
| Standard Deviation (Sample) | 15.8% | 12.9% |
| Standard Deviation (Population) | 15.6% | 12.7% |
Similar Demographics by Child Poverty Among Girls Under 16
Demographics Similar to Slavs by Child Poverty Among Girls Under 16
In terms of child poverty among girls under 16, the demographic groups most similar to Slavs are Icelander (15.7%, a difference of 0.15%), Samoan (15.7%, a difference of 0.23%), Immigrants from Hungary (15.8%, a difference of 0.46%), Immigrants from Albania (15.8%, a difference of 0.50%), and Welsh (15.6%, a difference of 0.53%).
| Demographics | Rating | Rank | Child Poverty Among Girls Under 16 |
| New Zealanders | 87.2 /100 | #140 | Excellent 15.6% |
| Immigrants | Jordan | 87.2 /100 | #141 | Excellent 15.6% |
| Canadians | 87.1 /100 | #142 | Excellent 15.6% |
| Immigrants | Peru | 86.6 /100 | #143 | Excellent 15.6% |
| Israelis | 86.3 /100 | #144 | Excellent 15.6% |
| Welsh | 85.4 /100 | #145 | Excellent 15.6% |
| Samoans | 84.2 /100 | #146 | Excellent 15.7% |
| Slavs | 83.1 /100 | #147 | Excellent 15.7% |
| Icelanders | 82.4 /100 | #148 | Excellent 15.7% |
| Immigrants | Hungary | 80.9 /100 | #149 | Excellent 15.8% |
| Immigrants | Albania | 80.7 /100 | #150 | Excellent 15.8% |
| Venezuelans | 80.1 /100 | #151 | Excellent 15.8% |
| Immigrants | Kuwait | 79.4 /100 | #152 | Good 15.8% |
| Immigrants | Nepal | 78.5 /100 | #153 | Good 15.9% |
| Immigrants | Chile | 76.7 /100 | #154 | Good 15.9% |
Demographics Similar to Delaware by Child Poverty Among Girls Under 16
In terms of child poverty among girls under 16, the demographic groups most similar to Delaware are Hmong (17.5%, a difference of 0.25%), Immigrants from Cameroon (17.4%, a difference of 0.27%), Iraqi (17.4%, a difference of 0.37%), Sierra Leonean (17.6%, a difference of 0.78%), and Panamanian (17.6%, a difference of 0.84%).
| Demographics | Rating | Rank | Child Poverty Among Girls Under 16 |
| Immigrants | Afghanistan | 22.4 /100 | #199 | Fair 17.1% |
| Immigrants | Uzbekistan | 21.5 /100 | #200 | Fair 17.1% |
| Immigrants | Kenya | 17.8 /100 | #201 | Poor 17.2% |
| Immigrants | Sierra Leone | 17.6 /100 | #202 | Poor 17.2% |
| Ugandans | 17.5 /100 | #203 | Poor 17.2% |
| Iraqis | 13.0 /100 | #204 | Poor 17.4% |
| Immigrants | Cameroon | 12.6 /100 | #205 | Poor 17.4% |
| Delaware | 11.5 /100 | #206 | Poor 17.4% |
| Hmong | 10.6 /100 | #207 | Poor 17.5% |
| Sierra Leoneans | 8.9 /100 | #208 | Tragic 17.6% |
| Panamanians | 8.7 /100 | #209 | Tragic 17.6% |
| Immigrants | Immigrants | 7.3 /100 | #210 | Tragic 17.7% |
| Immigrants | Eastern Africa | 6.4 /100 | #211 | Tragic 17.7% |
| Immigrants | Thailand | 6.3 /100 | #212 | Tragic 17.7% |
| Pennsylvania Germans | 5.7 /100 | #213 | Tragic 17.8% |