Carpatho Rusyn vs Immigrants from Micronesia Child Poverty Among Boys Under 16
COMPARE
Carpatho Rusyn
Immigrants from Micronesia
Child Poverty Among Boys Under 16
Child Poverty Among Boys Under 16 Comparison
Carpatho Rusyns
Immigrants from Micronesia
15.4%
CHILD POVERTY AMONG BOYS UNDER 16
91.1/ 100
METRIC RATING
127th/ 347
METRIC RANK
18.3%
CHILD POVERTY AMONG BOYS UNDER 16
1.8/ 100
METRIC RATING
229th/ 347
METRIC RANK
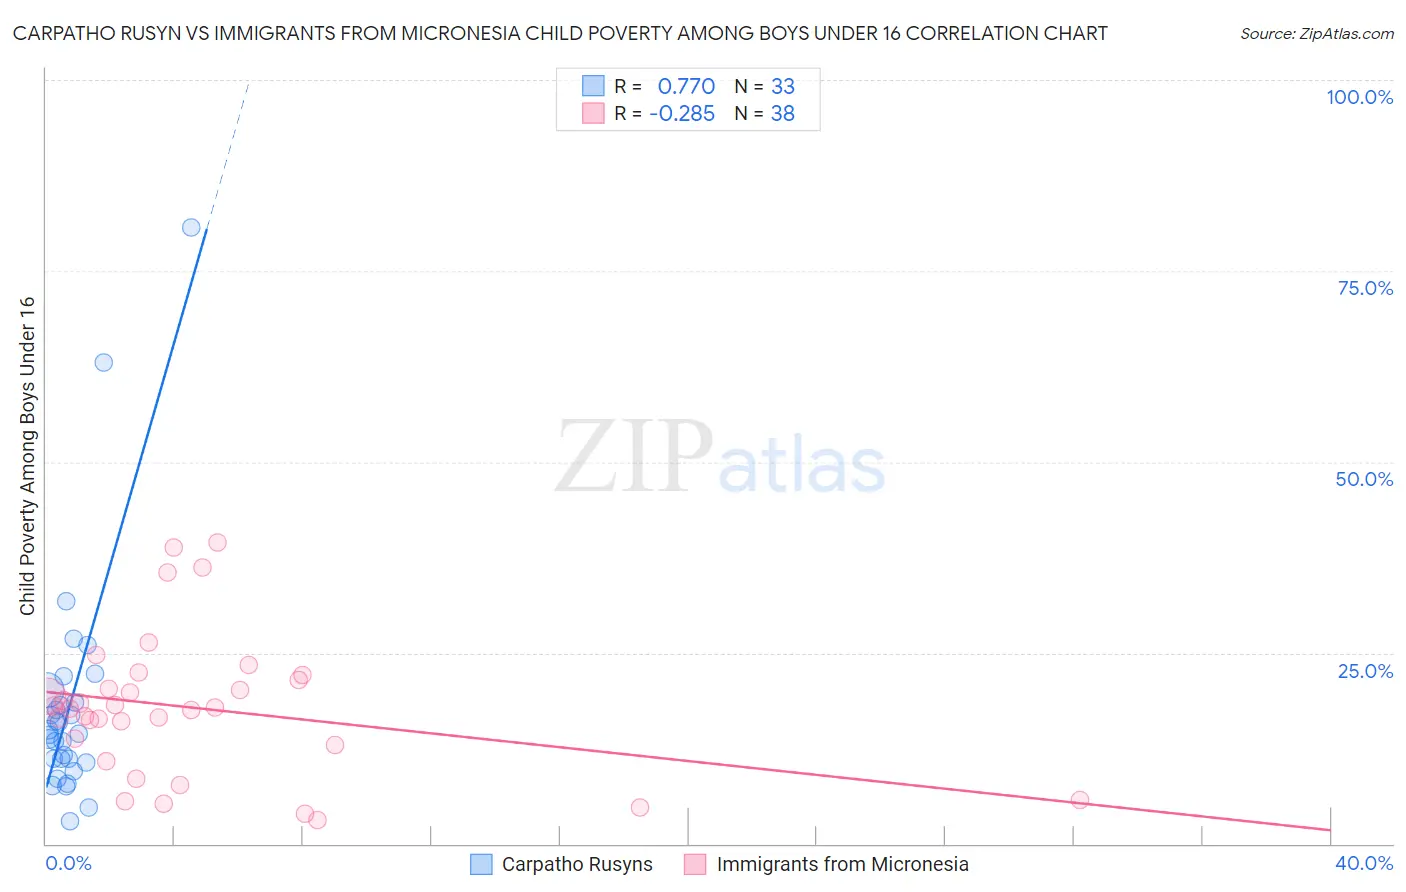
Carpatho Rusyn vs Immigrants from Micronesia Child Poverty Among Boys Under 16 Correlation Chart
The statistical analysis conducted on geographies consisting of 58,506,297 people shows a strong positive correlation between the proportion of Carpatho Rusyns and poverty level among boys under the age of 16 in the United States with a correlation coefficient (R) of 0.770 and weighted average of 15.4%. Similarly, the statistical analysis conducted on geographies consisting of 61,480,670 people shows a weak negative correlation between the proportion of Immigrants from Micronesia and poverty level among boys under the age of 16 in the United States with a correlation coefficient (R) of -0.285 and weighted average of 18.3%, a difference of 19.0%.
Child Poverty Among Boys Under 16 Correlation Summary
| Measurement | Carpatho Rusyn | Immigrants from Micronesia |
| Minimum | 3.0% | 3.0% |
| Maximum | 80.8% | 39.5% |
| Range | 77.8% | 36.4% |
| Mean | 18.2% | 17.8% |
| Median | 14.5% | 17.8% |
| Interquartile 25% (IQ1) | 10.9% | 12.9% |
| Interquartile 75% (IQ3) | 19.3% | 21.5% |
| Interquartile Range (IQR) | 8.4% | 8.6% |
| Standard Deviation (Sample) | 15.4% | 9.2% |
| Standard Deviation (Population) | 15.1% | 9.1% |
Similar Demographics by Child Poverty Among Boys Under 16
Demographics Similar to Carpatho Rusyns by Child Poverty Among Boys Under 16
In terms of child poverty among boys under 16, the demographic groups most similar to Carpatho Rusyns are Palestinian (15.4%, a difference of 0.050%), Canadian (15.4%, a difference of 0.19%), Immigrants from Brazil (15.4%, a difference of 0.31%), Mongolian (15.4%, a difference of 0.33%), and Czechoslovakian (15.3%, a difference of 0.36%).
| Demographics | Rating | Rank | Child Poverty Among Boys Under 16 |
| South Africans | 93.0 /100 | #120 | Exceptional 15.2% |
| Scottish | 93.0 /100 | #121 | Exceptional 15.2% |
| Immigrants | Malaysia | 92.8 /100 | #122 | Exceptional 15.3% |
| Immigrants | Norway | 92.3 /100 | #123 | Exceptional 15.3% |
| Tlingit-Haida | 92.2 /100 | #124 | Exceptional 15.3% |
| Czechoslovakians | 92.1 /100 | #125 | Exceptional 15.3% |
| Palestinians | 91.3 /100 | #126 | Exceptional 15.4% |
| Carpatho Rusyns | 91.1 /100 | #127 | Exceptional 15.4% |
| Canadians | 90.6 /100 | #128 | Exceptional 15.4% |
| Immigrants | Brazil | 90.3 /100 | #129 | Exceptional 15.4% |
| Mongolians | 90.2 /100 | #130 | Exceptional 15.4% |
| Immigrants | Western Europe | 90.0 /100 | #131 | Exceptional 15.4% |
| Immigrants | Kazakhstan | 88.7 /100 | #132 | Excellent 15.5% |
| Welsh | 88.3 /100 | #133 | Excellent 15.5% |
| Peruvians | 88.1 /100 | #134 | Excellent 15.5% |
Demographics Similar to Immigrants from Micronesia by Child Poverty Among Boys Under 16
In terms of child poverty among boys under 16, the demographic groups most similar to Immigrants from Micronesia are Fijian (18.3%, a difference of 0.0%), Nonimmigrants (18.2%, a difference of 0.52%), Nicaraguan (18.4%, a difference of 0.53%), Marshallese (18.4%, a difference of 0.73%), and Bermudan (18.1%, a difference of 0.85%).
| Demographics | Rating | Rank | Child Poverty Among Boys Under 16 |
| Pennsylvania Germans | 3.9 /100 | #222 | Tragic 17.9% |
| Cubans | 3.8 /100 | #223 | Tragic 17.9% |
| Nepalese | 3.2 /100 | #224 | Tragic 18.0% |
| Inupiat | 2.7 /100 | #225 | Tragic 18.1% |
| Immigrants | Africa | 2.6 /100 | #226 | Tragic 18.1% |
| Bermudans | 2.5 /100 | #227 | Tragic 18.1% |
| Immigrants | Nonimmigrants | 2.2 /100 | #228 | Tragic 18.2% |
| Immigrants | Micronesia | 1.8 /100 | #229 | Tragic 18.3% |
| Fijians | 1.8 /100 | #230 | Tragic 18.3% |
| Nicaraguans | 1.4 /100 | #231 | Tragic 18.4% |
| Marshallese | 1.3 /100 | #232 | Tragic 18.4% |
| Immigrants | Nigeria | 1.2 /100 | #233 | Tragic 18.4% |
| Nigerians | 1.1 /100 | #234 | Tragic 18.5% |
| Americans | 0.9 /100 | #235 | Tragic 18.6% |
| Sudanese | 0.9 /100 | #236 | Tragic 18.6% |