Alsatian vs Immigrants from Micronesia Child Poverty Among Boys Under 16
COMPARE
Alsatian
Immigrants from Micronesia
Child Poverty Among Boys Under 16
Child Poverty Among Boys Under 16 Comparison
Alsatians
Immigrants from Micronesia
19.1%
CHILD POVERTY AMONG BOYS UNDER 16
0.3/ 100
METRIC RATING
249th/ 347
METRIC RANK
18.3%
CHILD POVERTY AMONG BOYS UNDER 16
1.8/ 100
METRIC RATING
229th/ 347
METRIC RANK
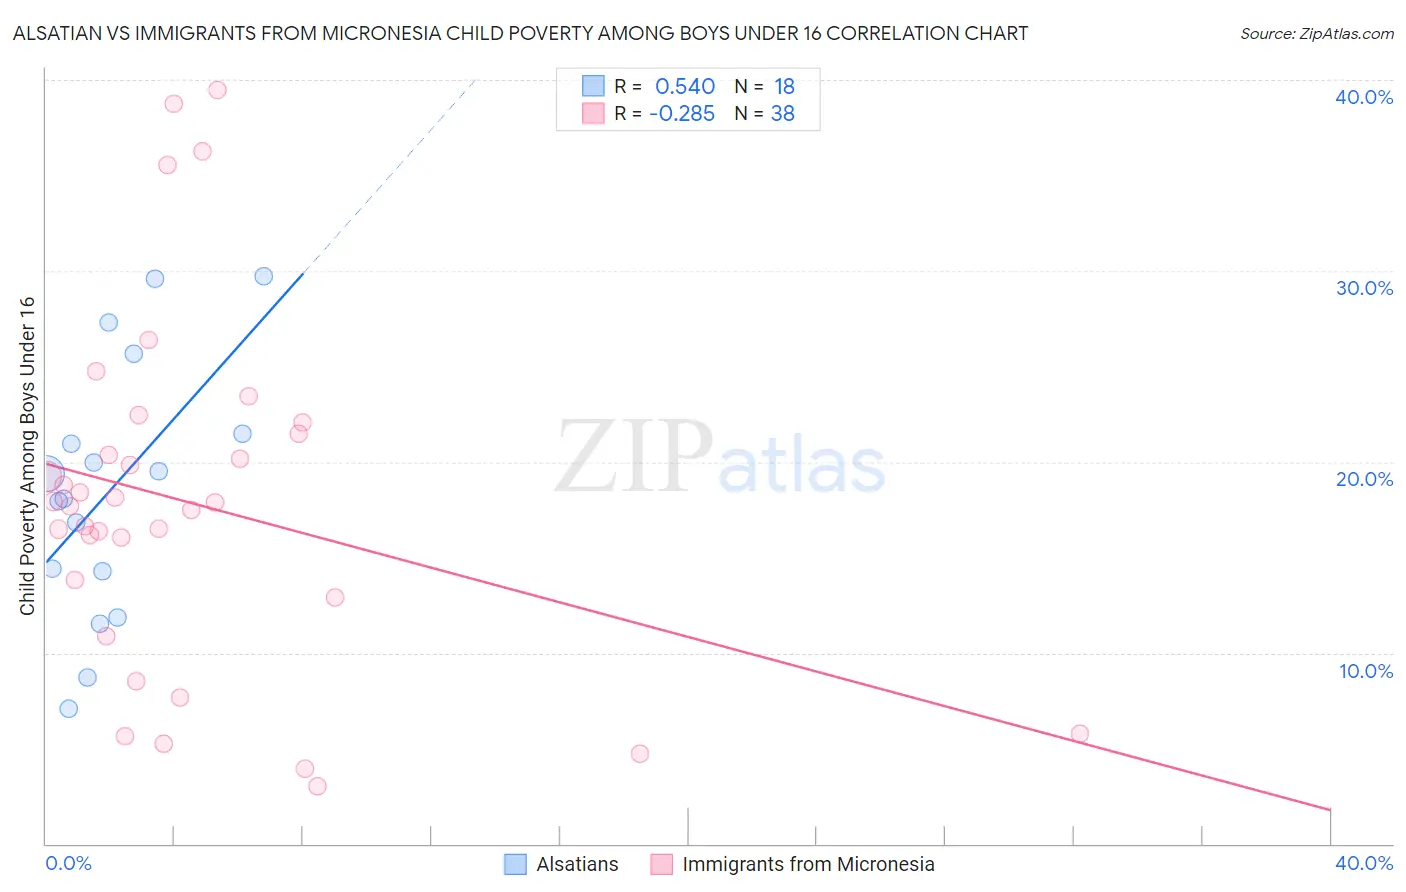
Alsatian vs Immigrants from Micronesia Child Poverty Among Boys Under 16 Correlation Chart
The statistical analysis conducted on geographies consisting of 82,051,026 people shows a substantial positive correlation between the proportion of Alsatians and poverty level among boys under the age of 16 in the United States with a correlation coefficient (R) of 0.540 and weighted average of 19.1%. Similarly, the statistical analysis conducted on geographies consisting of 61,480,670 people shows a weak negative correlation between the proportion of Immigrants from Micronesia and poverty level among boys under the age of 16 in the United States with a correlation coefficient (R) of -0.285 and weighted average of 18.3%, a difference of 4.4%.
Child Poverty Among Boys Under 16 Correlation Summary
| Measurement | Alsatian | Immigrants from Micronesia |
| Minimum | 7.1% | 3.0% |
| Maximum | 29.7% | 39.5% |
| Range | 22.7% | 36.4% |
| Mean | 18.6% | 17.8% |
| Median | 18.7% | 17.8% |
| Interquartile 25% (IQ1) | 14.3% | 12.9% |
| Interquartile 75% (IQ3) | 21.5% | 21.5% |
| Interquartile Range (IQR) | 7.2% | 8.6% |
| Standard Deviation (Sample) | 6.7% | 9.2% |
| Standard Deviation (Population) | 6.5% | 9.1% |
Demographics Similar to Alsatians and Immigrants from Micronesia by Child Poverty Among Boys Under 16
In terms of child poverty among boys under 16, the demographic groups most similar to Alsatians are Salvadoran (19.0%, a difference of 0.17%), Immigrants from Trinidad and Tobago (19.0%, a difference of 0.25%), Immigrants from Nicaragua (19.0%, a difference of 0.37%), Cree (19.0%, a difference of 0.57%), and Immigrants from Middle Africa (18.9%, a difference of 0.70%). Similarly, the demographic groups most similar to Immigrants from Micronesia are Fijian (18.3%, a difference of 0.0%), Nicaraguan (18.4%, a difference of 0.53%), Marshallese (18.4%, a difference of 0.73%), Immigrants from Nigeria (18.4%, a difference of 0.92%), and Nigerian (18.5%, a difference of 1.2%).
| Demographics | Rating | Rank | Child Poverty Among Boys Under 16 |
| Immigrants | Micronesia | 1.8 /100 | #229 | Tragic 18.3% |
| Fijians | 1.8 /100 | #230 | Tragic 18.3% |
| Nicaraguans | 1.4 /100 | #231 | Tragic 18.4% |
| Marshallese | 1.3 /100 | #232 | Tragic 18.4% |
| Immigrants | Nigeria | 1.2 /100 | #233 | Tragic 18.4% |
| Nigerians | 1.1 /100 | #234 | Tragic 18.5% |
| Americans | 0.9 /100 | #235 | Tragic 18.6% |
| Sudanese | 0.9 /100 | #236 | Tragic 18.6% |
| Immigrants | Eritrea | 0.8 /100 | #237 | Tragic 18.6% |
| Immigrants | Laos | 0.8 /100 | #238 | Tragic 18.7% |
| Cape Verdeans | 0.7 /100 | #239 | Tragic 18.7% |
| Immigrants | Cuba | 0.6 /100 | #240 | Tragic 18.8% |
| Immigrants | Sudan | 0.6 /100 | #241 | Tragic 18.8% |
| Ghanaians | 0.5 /100 | #242 | Tragic 18.9% |
| Immigrants | Azores | 0.4 /100 | #243 | Tragic 18.9% |
| Immigrants | Middle Africa | 0.4 /100 | #244 | Tragic 18.9% |
| Cree | 0.4 /100 | #245 | Tragic 19.0% |
| Immigrants | Nicaragua | 0.4 /100 | #246 | Tragic 19.0% |
| Immigrants | Trinidad and Tobago | 0.3 /100 | #247 | Tragic 19.0% |
| Salvadorans | 0.3 /100 | #248 | Tragic 19.0% |
| Alsatians | 0.3 /100 | #249 | Tragic 19.1% |