Sioux vs Immigrants from Thailand Male Poverty
COMPARE
Sioux
Immigrants from Thailand
Male Poverty
Male Poverty Comparison
Sioux
Immigrants from Thailand
18.7%
MALE POVERTY
0.0/ 100
METRIC RATING
337th/ 347
METRIC RANK
12.2%
MALE POVERTY
2.5/ 100
METRIC RATING
217th/ 347
METRIC RANK
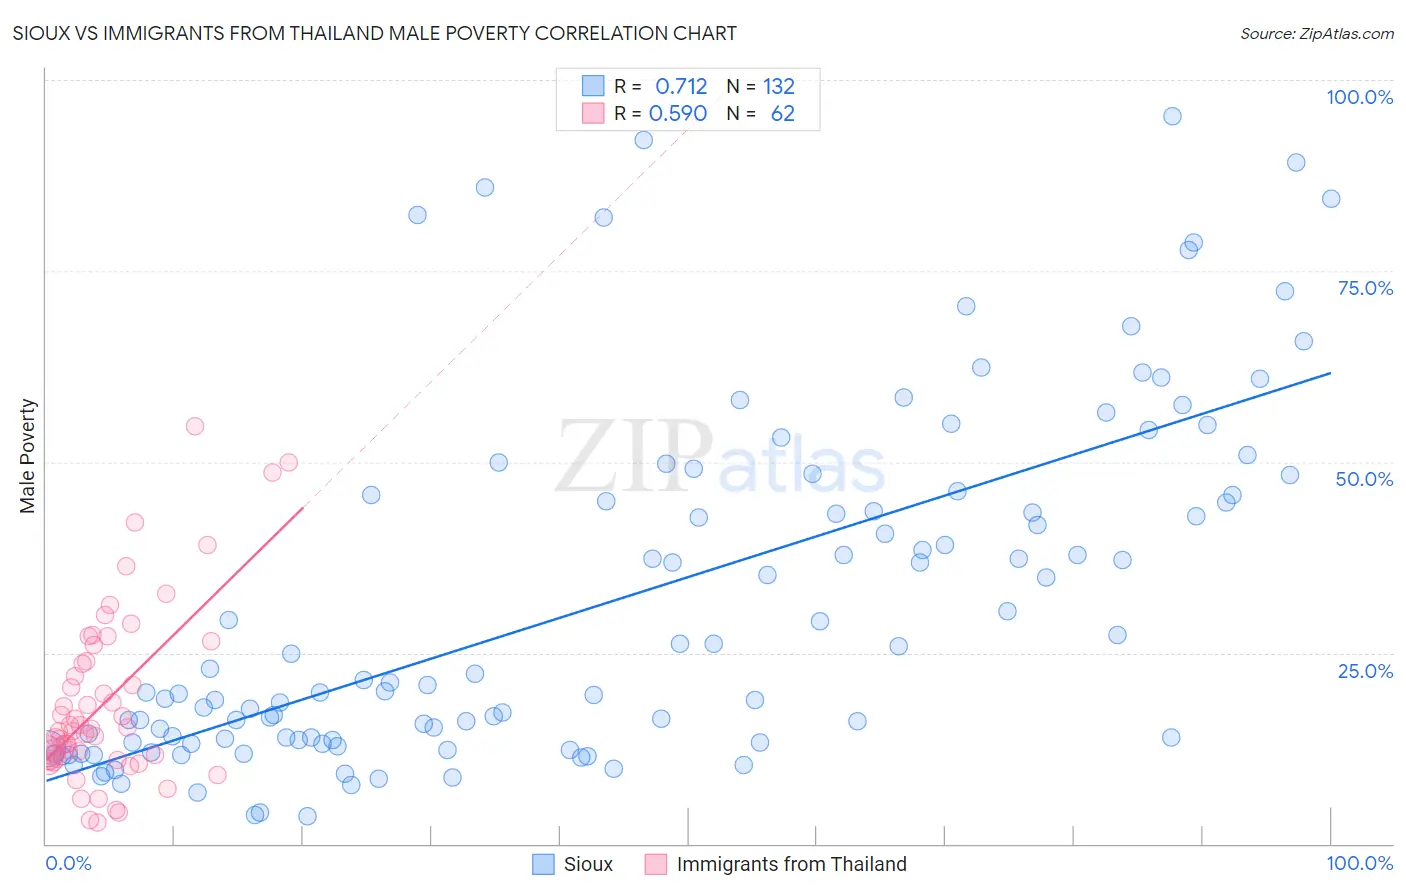
Sioux vs Immigrants from Thailand Male Poverty Correlation Chart
The statistical analysis conducted on geographies consisting of 234,075,552 people shows a strong positive correlation between the proportion of Sioux and poverty level among males in the United States with a correlation coefficient (R) of 0.712 and weighted average of 18.7%. Similarly, the statistical analysis conducted on geographies consisting of 316,895,557 people shows a substantial positive correlation between the proportion of Immigrants from Thailand and poverty level among males in the United States with a correlation coefficient (R) of 0.590 and weighted average of 12.2%, a difference of 53.3%.
Male Poverty Correlation Summary
| Measurement | Sioux | Immigrants from Thailand |
| Minimum | 3.5% | 2.7% |
| Maximum | 95.3% | 54.6% |
| Range | 91.7% | 51.9% |
| Mean | 31.5% | 18.5% |
| Median | 20.9% | 14.9% |
| Interquartile 25% (IQ1) | 13.4% | 11.2% |
| Interquartile 75% (IQ3) | 45.7% | 23.8% |
| Interquartile Range (IQR) | 32.2% | 12.6% |
| Standard Deviation (Sample) | 22.7% | 11.4% |
| Standard Deviation (Population) | 22.6% | 11.3% |
Similar Demographics by Male Poverty
Demographics Similar to Sioux by Male Poverty
In terms of male poverty, the demographic groups most similar to Sioux are Pueblo (18.5%, a difference of 1.1%), Crow (19.1%, a difference of 2.3%), Yuman (19.5%, a difference of 4.5%), Apache (17.7%, a difference of 5.9%), and Cheyenne (17.6%, a difference of 6.1%).
| Demographics | Rating | Rank | Male Poverty |
| Immigrants | Dominican Republic | 0.0 /100 | #330 | Tragic 16.2% |
| Ute | 0.0 /100 | #331 | Tragic 16.2% |
| Houma | 0.0 /100 | #332 | Tragic 16.7% |
| Natives/Alaskans | 0.0 /100 | #333 | Tragic 16.9% |
| Cheyenne | 0.0 /100 | #334 | Tragic 17.6% |
| Apache | 0.0 /100 | #335 | Tragic 17.7% |
| Pueblo | 0.0 /100 | #336 | Tragic 18.5% |
| Sioux | 0.0 /100 | #337 | Tragic 18.7% |
| Crow | 0.0 /100 | #338 | Tragic 19.1% |
| Yuman | 0.0 /100 | #339 | Tragic 19.5% |
| Immigrants | Yemen | 0.0 /100 | #340 | Tragic 20.1% |
| Lumbee | 0.0 /100 | #341 | Tragic 20.2% |
| Pima | 0.0 /100 | #342 | Tragic 20.4% |
| Yup'ik | 0.0 /100 | #343 | Tragic 20.4% |
| Hopi | 0.0 /100 | #344 | Tragic 20.8% |
Demographics Similar to Immigrants from Thailand by Male Poverty
In terms of male poverty, the demographic groups most similar to Immigrants from Thailand are Immigrants from Cambodia (12.2%, a difference of 0.010%), German Russian (12.2%, a difference of 0.020%), Immigrants from Uzbekistan (12.2%, a difference of 0.090%), Bermudan (12.2%, a difference of 0.090%), and Immigrants from Eritrea (12.2%, a difference of 0.11%).
| Demographics | Rating | Rank | Male Poverty |
| Moroccans | 4.2 /100 | #210 | Tragic 12.0% |
| Immigrants | Panama | 4.0 /100 | #211 | Tragic 12.1% |
| Americans | 3.2 /100 | #212 | Tragic 12.1% |
| Immigrants | Nonimmigrants | 3.1 /100 | #213 | Tragic 12.1% |
| Japanese | 2.7 /100 | #214 | Tragic 12.2% |
| Immigrants | Uzbekistan | 2.6 /100 | #215 | Tragic 12.2% |
| Immigrants | Cambodia | 2.5 /100 | #216 | Tragic 12.2% |
| Immigrants | Thailand | 2.5 /100 | #217 | Tragic 12.2% |
| German Russians | 2.5 /100 | #218 | Tragic 12.2% |
| Bermudans | 2.4 /100 | #219 | Tragic 12.2% |
| Immigrants | Eritrea | 2.4 /100 | #220 | Tragic 12.2% |
| Ugandans | 2.2 /100 | #221 | Tragic 12.2% |
| Immigrants | Africa | 2.1 /100 | #222 | Tragic 12.2% |
| Immigrants | Micronesia | 2.1 /100 | #223 | Tragic 12.2% |
| Immigrants | Nigeria | 1.6 /100 | #224 | Tragic 12.3% |