Sioux vs Immigrants from Albania Male Poverty
COMPARE
Sioux
Immigrants from Albania
Male Poverty
Male Poverty Comparison
Sioux
Immigrants from Albania
18.7%
MALE POVERTY
0.0/ 100
METRIC RATING
337th/ 347
METRIC RANK
11.1%
MALE POVERTY
55.3/ 100
METRIC RATING
166th/ 347
METRIC RANK
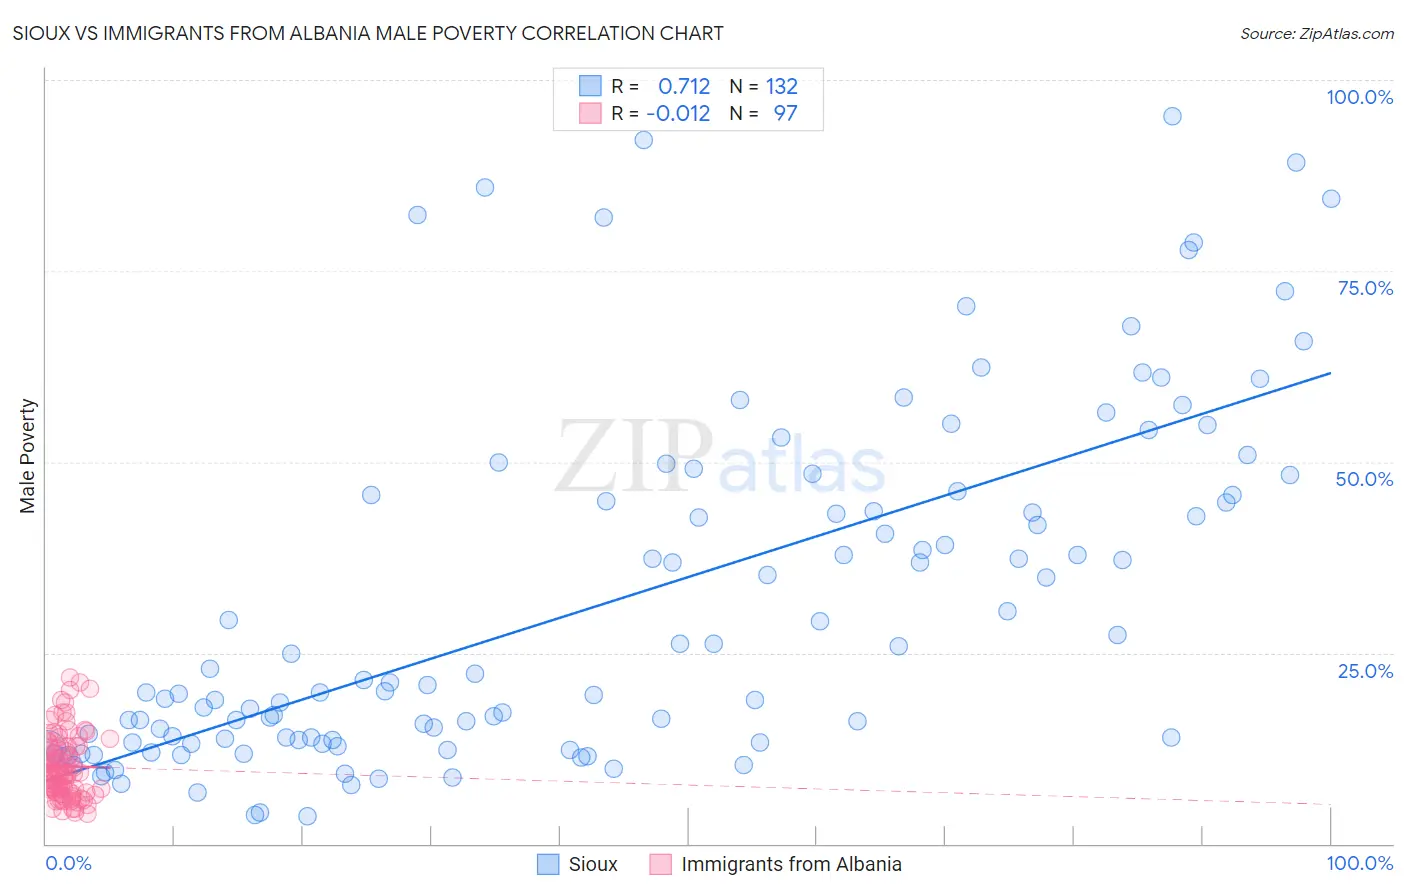
Sioux vs Immigrants from Albania Male Poverty Correlation Chart
The statistical analysis conducted on geographies consisting of 234,075,552 people shows a strong positive correlation between the proportion of Sioux and poverty level among males in the United States with a correlation coefficient (R) of 0.712 and weighted average of 18.7%. Similarly, the statistical analysis conducted on geographies consisting of 119,357,125 people shows no correlation between the proportion of Immigrants from Albania and poverty level among males in the United States with a correlation coefficient (R) of -0.012 and weighted average of 11.1%, a difference of 68.0%.
Male Poverty Correlation Summary
| Measurement | Sioux | Immigrants from Albania |
| Minimum | 3.5% | 4.0% |
| Maximum | 95.3% | 21.8% |
| Range | 91.7% | 17.8% |
| Mean | 31.5% | 10.2% |
| Median | 20.9% | 9.3% |
| Interquartile 25% (IQ1) | 13.4% | 6.9% |
| Interquartile 75% (IQ3) | 45.7% | 12.8% |
| Interquartile Range (IQR) | 32.2% | 5.9% |
| Standard Deviation (Sample) | 22.7% | 4.2% |
| Standard Deviation (Population) | 22.6% | 4.2% |
Similar Demographics by Male Poverty
Demographics Similar to Sioux by Male Poverty
In terms of male poverty, the demographic groups most similar to Sioux are Pueblo (18.5%, a difference of 1.1%), Crow (19.1%, a difference of 2.3%), Yuman (19.5%, a difference of 4.5%), Apache (17.7%, a difference of 5.9%), and Cheyenne (17.6%, a difference of 6.1%).
| Demographics | Rating | Rank | Male Poverty |
| Immigrants | Dominican Republic | 0.0 /100 | #330 | Tragic 16.2% |
| Ute | 0.0 /100 | #331 | Tragic 16.2% |
| Houma | 0.0 /100 | #332 | Tragic 16.7% |
| Natives/Alaskans | 0.0 /100 | #333 | Tragic 16.9% |
| Cheyenne | 0.0 /100 | #334 | Tragic 17.6% |
| Apache | 0.0 /100 | #335 | Tragic 17.7% |
| Pueblo | 0.0 /100 | #336 | Tragic 18.5% |
| Sioux | 0.0 /100 | #337 | Tragic 18.7% |
| Crow | 0.0 /100 | #338 | Tragic 19.1% |
| Yuman | 0.0 /100 | #339 | Tragic 19.5% |
| Immigrants | Yemen | 0.0 /100 | #340 | Tragic 20.1% |
| Lumbee | 0.0 /100 | #341 | Tragic 20.2% |
| Pima | 0.0 /100 | #342 | Tragic 20.4% |
| Yup'ik | 0.0 /100 | #343 | Tragic 20.4% |
| Hopi | 0.0 /100 | #344 | Tragic 20.8% |
Demographics Similar to Immigrants from Albania by Male Poverty
In terms of male poverty, the demographic groups most similar to Immigrants from Albania are Immigrants from Spain (11.1%, a difference of 0.020%), Hungarian (11.1%, a difference of 0.020%), Immigrants from Portugal (11.1%, a difference of 0.040%), Immigrants from Colombia (11.1%, a difference of 0.11%), and White/Caucasian (11.1%, a difference of 0.14%).
| Demographics | Rating | Rank | Male Poverty |
| Taiwanese | 62.7 /100 | #159 | Good 11.0% |
| Soviet Union | 60.3 /100 | #160 | Good 11.1% |
| Immigrants | Northern Africa | 59.7 /100 | #161 | Average 11.1% |
| Immigrants | Chile | 57.4 /100 | #162 | Average 11.1% |
| Whites/Caucasians | 56.7 /100 | #163 | Average 11.1% |
| Ethiopians | 56.7 /100 | #164 | Average 11.1% |
| Immigrants | Spain | 55.5 /100 | #165 | Average 11.1% |
| Immigrants | Albania | 55.3 /100 | #166 | Average 11.1% |
| Hungarians | 55.1 /100 | #167 | Average 11.1% |
| Immigrants | Portugal | 54.9 /100 | #168 | Average 11.1% |
| Immigrants | Colombia | 54.2 /100 | #169 | Average 11.1% |
| South Americans | 53.8 /100 | #170 | Average 11.1% |
| Uruguayans | 51.0 /100 | #171 | Average 11.2% |
| Immigrants | Ethiopia | 50.7 /100 | #172 | Average 11.2% |
| Pennsylvania Germans | 50.5 /100 | #173 | Average 11.2% |