Sioux vs Polish Female Poverty Among 25-34 Year Olds
COMPARE
Sioux
Polish
Female Poverty Among 25-34 Year Olds
Female Poverty Among 25-34 Year Olds Comparison
Sioux
Poles
23.0%
FEMALE POVERTY AMONG 25-34 YEAR OLDS
0.0/ 100
METRIC RATING
340th/ 347
METRIC RANK
12.7%
FEMALE POVERTY AMONG 25-34 YEAR OLDS
94.9/ 100
METRIC RATING
107th/ 347
METRIC RANK
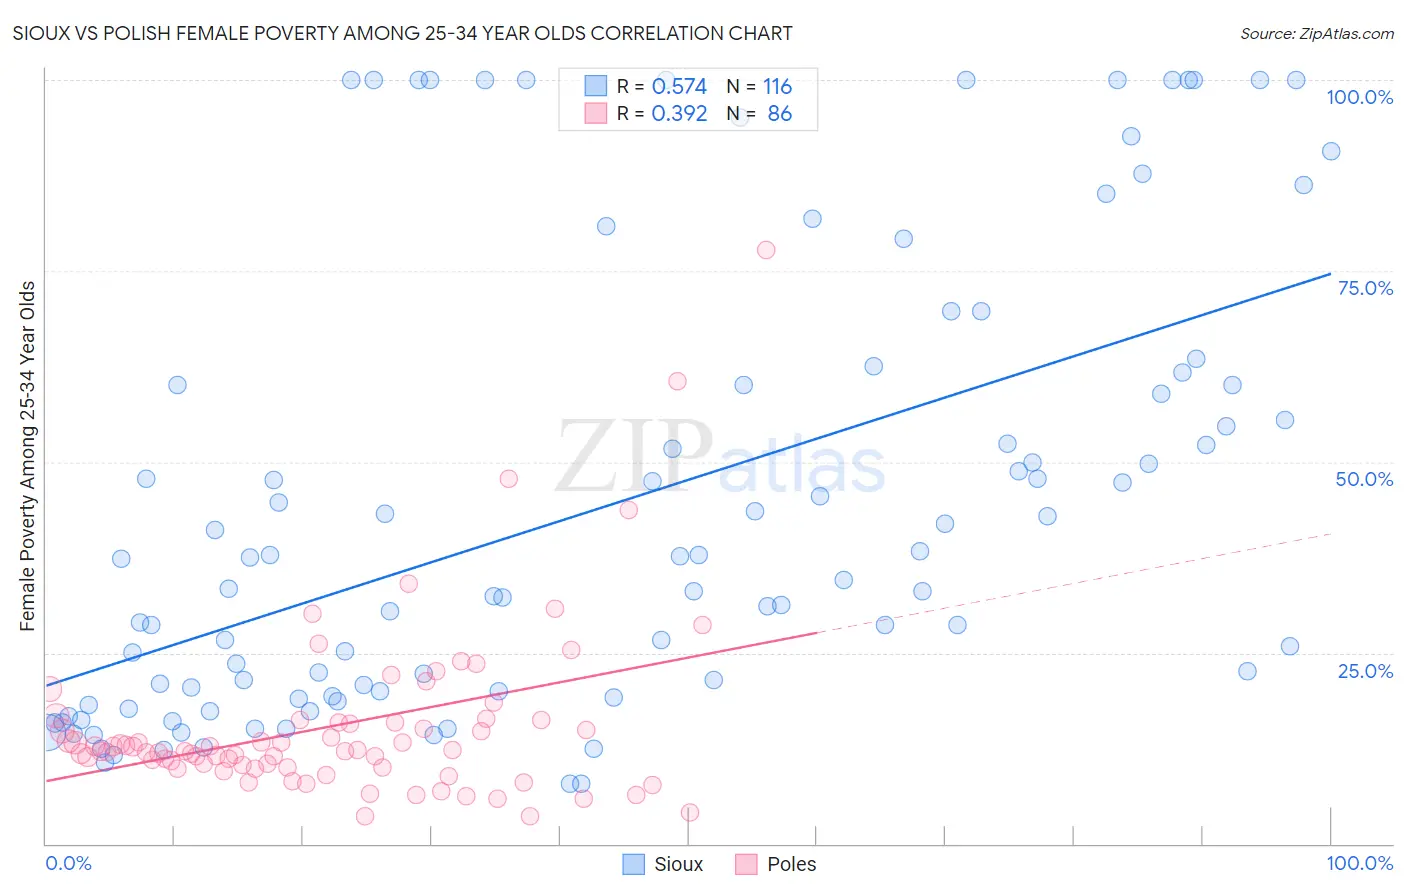
Sioux vs Polish Female Poverty Among 25-34 Year Olds Correlation Chart
The statistical analysis conducted on geographies consisting of 232,165,321 people shows a substantial positive correlation between the proportion of Sioux and poverty level among females between the ages 25 and 34 in the United States with a correlation coefficient (R) of 0.574 and weighted average of 23.0%. Similarly, the statistical analysis conducted on geographies consisting of 539,020,076 people shows a mild positive correlation between the proportion of Poles and poverty level among females between the ages 25 and 34 in the United States with a correlation coefficient (R) of 0.392 and weighted average of 12.7%, a difference of 80.7%.
Female Poverty Among 25-34 Year Olds Correlation Summary
| Measurement | Sioux | Polish |
| Minimum | 7.9% | 3.5% |
| Maximum | 100.0% | 77.8% |
| Range | 92.1% | 74.2% |
| Mean | 44.2% | 15.4% |
| Median | 36.0% | 12.2% |
| Interquartile 25% (IQ1) | 19.6% | 10.0% |
| Interquartile 75% (IQ3) | 60.0% | 15.9% |
| Interquartile Range (IQR) | 40.4% | 5.9% |
| Standard Deviation (Sample) | 29.3% | 11.5% |
| Standard Deviation (Population) | 29.2% | 11.4% |
Similar Demographics by Female Poverty Among 25-34 Year Olds
Demographics Similar to Sioux by Female Poverty Among 25-34 Year Olds
In terms of female poverty among 25-34 year olds, the demographic groups most similar to Sioux are Yuman (22.9%, a difference of 0.18%), Houma (22.7%, a difference of 1.0%), Crow (22.7%, a difference of 1.2%), Navajo (23.3%, a difference of 1.7%), and Hopi (23.7%, a difference of 3.1%).
| Demographics | Rating | Rank | Female Poverty Among 25-34 Year Olds |
| Cajuns | 0.0 /100 | #333 | Tragic 19.9% |
| Apache | 0.0 /100 | #334 | Tragic 20.1% |
| Natives/Alaskans | 0.0 /100 | #335 | Tragic 20.3% |
| Pueblo | 0.0 /100 | #336 | Tragic 22.2% |
| Crow | 0.0 /100 | #337 | Tragic 22.7% |
| Houma | 0.0 /100 | #338 | Tragic 22.7% |
| Yuman | 0.0 /100 | #339 | Tragic 22.9% |
| Sioux | 0.0 /100 | #340 | Tragic 23.0% |
| Navajo | 0.0 /100 | #341 | Tragic 23.3% |
| Hopi | 0.0 /100 | #342 | Tragic 23.7% |
| Yup'ik | 0.0 /100 | #343 | Tragic 24.3% |
| Tohono O'odham | 0.0 /100 | #344 | Tragic 24.7% |
| Pima | 0.0 /100 | #345 | Tragic 25.3% |
| Lumbee | 0.0 /100 | #346 | Tragic 26.3% |
| Puerto Ricans | 0.0 /100 | #347 | Tragic 26.3% |
Demographics Similar to Poles by Female Poverty Among 25-34 Year Olds
In terms of female poverty among 25-34 year olds, the demographic groups most similar to Poles are Tsimshian (12.7%, a difference of 0.050%), Immigrants from South Africa (12.7%, a difference of 0.15%), Swedish (12.7%, a difference of 0.20%), Immigrants from Spain (12.7%, a difference of 0.25%), and Immigrants from Norway (12.7%, a difference of 0.25%).
| Demographics | Rating | Rank | Female Poverty Among 25-34 Year Olds |
| Immigrants | Denmark | 95.7 /100 | #100 | Exceptional 12.7% |
| Immigrants | Switzerland | 95.7 /100 | #101 | Exceptional 12.7% |
| Peruvians | 95.6 /100 | #102 | Exceptional 12.7% |
| Immigrants | Spain | 95.5 /100 | #103 | Exceptional 12.7% |
| Swedes | 95.4 /100 | #104 | Exceptional 12.7% |
| Immigrants | South Africa | 95.3 /100 | #105 | Exceptional 12.7% |
| Tsimshian | 95.1 /100 | #106 | Exceptional 12.7% |
| Poles | 94.9 /100 | #107 | Exceptional 12.7% |
| Immigrants | Norway | 94.4 /100 | #108 | Exceptional 12.7% |
| Immigrants | Peru | 94.3 /100 | #109 | Exceptional 12.7% |
| Australians | 94.1 /100 | #110 | Exceptional 12.8% |
| Danes | 93.9 /100 | #111 | Exceptional 12.8% |
| Immigrants | Morocco | 93.9 /100 | #112 | Exceptional 12.8% |
| Immigrants | Syria | 93.8 /100 | #113 | Exceptional 12.8% |
| Immigrants | Southern Europe | 93.6 /100 | #114 | Exceptional 12.8% |