Immigrants from Colombia vs Yup'ik Single Father Poverty
COMPARE
Immigrants from Colombia
Yup'ik
Single Father Poverty
Single Father Poverty Comparison
Immigrants from Colombia
Yup'ik
15.8%
SINGLE FATHER POVERTY
92.6/ 100
METRIC RATING
117th/ 347
METRIC RANK
32.5%
SINGLE FATHER POVERTY
0.0/ 100
METRIC RATING
347th/ 347
METRIC RANK
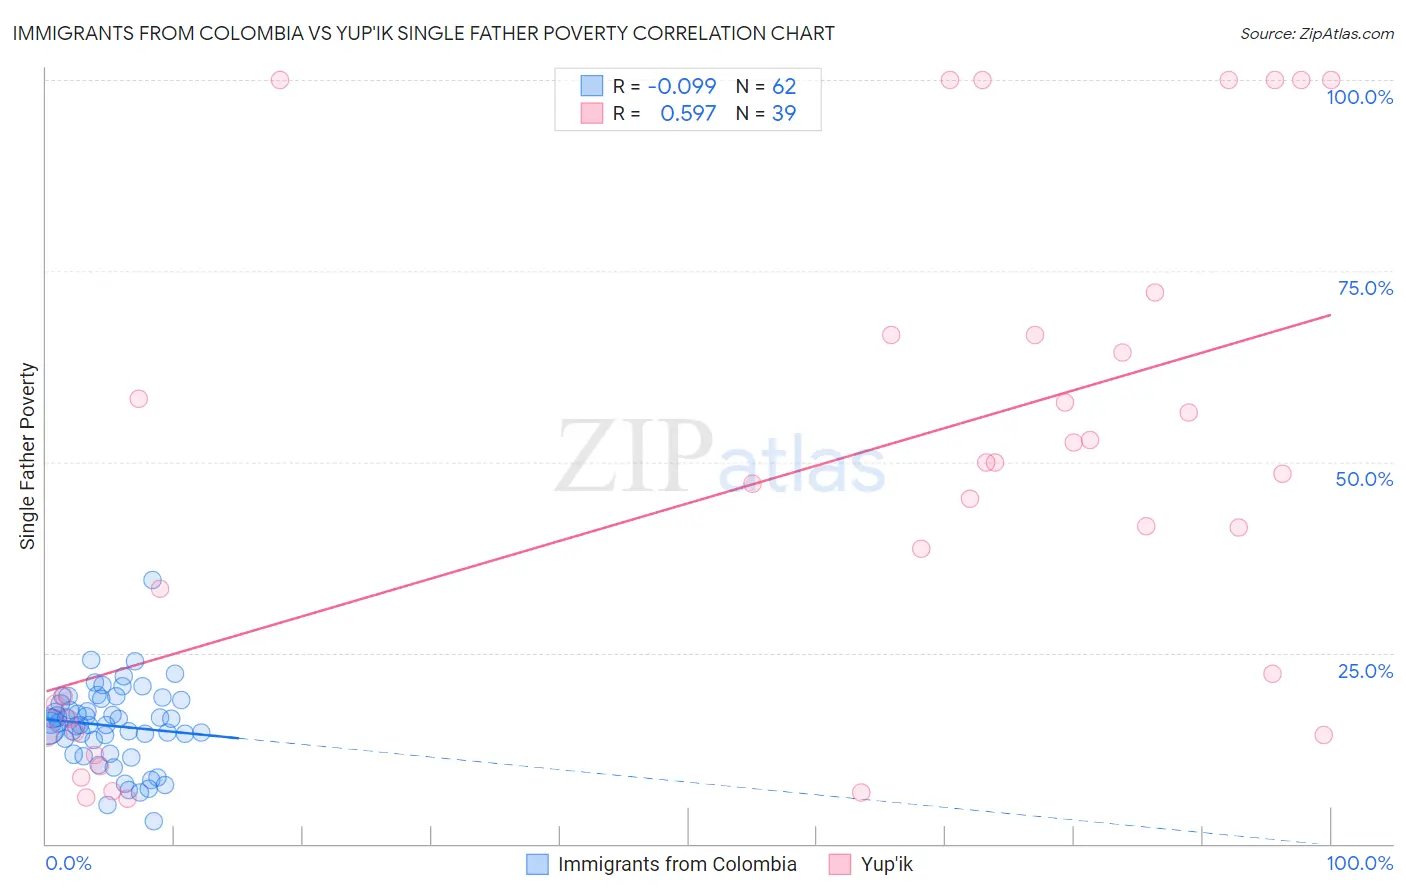
Immigrants from Colombia vs Yup'ik Single Father Poverty Correlation Chart
The statistical analysis conducted on geographies consisting of 300,736,141 people shows a slight negative correlation between the proportion of Immigrants from Colombia and poverty level among single fathers in the United States with a correlation coefficient (R) of -0.099 and weighted average of 15.8%. Similarly, the statistical analysis conducted on geographies consisting of 37,532,100 people shows a substantial positive correlation between the proportion of Yup'ik and poverty level among single fathers in the United States with a correlation coefficient (R) of 0.597 and weighted average of 32.5%, a difference of 105.3%.
Single Father Poverty Correlation Summary
| Measurement | Immigrants from Colombia | Yup'ik |
| Minimum | 2.9% | 5.9% |
| Maximum | 34.5% | 100.0% |
| Range | 31.5% | 94.1% |
| Mean | 15.5% | 46.6% |
| Median | 15.7% | 47.1% |
| Interquartile 25% (IQ1) | 13.6% | 14.6% |
| Interquartile 75% (IQ3) | 18.9% | 66.7% |
| Interquartile Range (IQR) | 5.3% | 52.0% |
| Standard Deviation (Sample) | 5.2% | 32.1% |
| Standard Deviation (Population) | 5.2% | 31.7% |
Similar Demographics by Single Father Poverty
Demographics Similar to Immigrants from Colombia by Single Father Poverty
In terms of single father poverty, the demographic groups most similar to Immigrants from Colombia are Immigrants from Eastern Europe (15.8%, a difference of 0.020%), Immigrants from Argentina (15.8%, a difference of 0.030%), Immigrants from Belarus (15.8%, a difference of 0.030%), Uruguayan (15.9%, a difference of 0.090%), and Immigrants (15.9%, a difference of 0.11%).
| Demographics | Rating | Rank | Single Father Poverty |
| Immigrants | Africa | 95.1 /100 | #110 | Exceptional 15.8% |
| Bulgarians | 94.8 /100 | #111 | Exceptional 15.8% |
| Immigrants | Latvia | 94.7 /100 | #112 | Exceptional 15.8% |
| Danes | 94.5 /100 | #113 | Exceptional 15.8% |
| Argentineans | 94.4 /100 | #114 | Exceptional 15.8% |
| Immigrants | Thailand | 93.6 /100 | #115 | Exceptional 15.8% |
| Immigrants | Argentina | 92.8 /100 | #116 | Exceptional 15.8% |
| Immigrants | Colombia | 92.6 /100 | #117 | Exceptional 15.8% |
| Immigrants | Eastern Europe | 92.5 /100 | #118 | Exceptional 15.8% |
| Immigrants | Belarus | 92.4 /100 | #119 | Exceptional 15.8% |
| Uruguayans | 92.1 /100 | #120 | Exceptional 15.9% |
| Immigrants | Immigrants | 91.9 /100 | #121 | Exceptional 15.9% |
| Sudanese | 91.6 /100 | #122 | Exceptional 15.9% |
| Palestinians | 91.3 /100 | #123 | Exceptional 15.9% |
| Immigrants | Panama | 91.3 /100 | #124 | Exceptional 15.9% |
Demographics Similar to Yup'ik by Single Father Poverty
In terms of single father poverty, the demographic groups most similar to Yup'ik are Puerto Rican (31.5%, a difference of 3.2%), Crow (30.3%, a difference of 7.4%), Navajo (29.2%, a difference of 11.3%), Lumbee (28.5%, a difference of 14.2%), and Yuman (28.4%, a difference of 14.6%).
| Demographics | Rating | Rank | Single Father Poverty |
| Natives/Alaskans | 0.0 /100 | #333 | Tragic 22.4% |
| Kiowa | 0.0 /100 | #334 | Tragic 22.5% |
| Shoshone | 0.0 /100 | #335 | Tragic 22.9% |
| Cajuns | 0.0 /100 | #336 | Tragic 23.1% |
| Sioux | 0.0 /100 | #337 | Tragic 23.9% |
| Arapaho | 0.0 /100 | #338 | Tragic 24.0% |
| Apache | 0.0 /100 | #339 | Tragic 24.2% |
| Houma | 0.0 /100 | #340 | Tragic 26.7% |
| Hopi | 0.0 /100 | #341 | Tragic 27.2% |
| Yuman | 0.0 /100 | #342 | Tragic 28.4% |
| Lumbee | 0.0 /100 | #343 | Tragic 28.5% |
| Navajo | 0.0 /100 | #344 | Tragic 29.2% |
| Crow | 0.0 /100 | #345 | Tragic 30.3% |
| Puerto Ricans | 0.0 /100 | #346 | Tragic 31.5% |
| Yup'ik | 0.0 /100 | #347 | Tragic 32.5% |