Shoshone vs British West Indian Child Poverty Under the Age of 5
COMPARE
Shoshone
British West Indian
Child Poverty Under the Age of 5
Child Poverty Under the Age of 5 Comparison
Shoshone
British West Indians
20.0%
CHILD POVERTY UNDER THE AGE OF 5
0.2/ 100
METRIC RATING
257th/ 347
METRIC RANK
21.4%
CHILD POVERTY UNDER THE AGE OF 5
0.0/ 100
METRIC RATING
291st/ 347
METRIC RANK
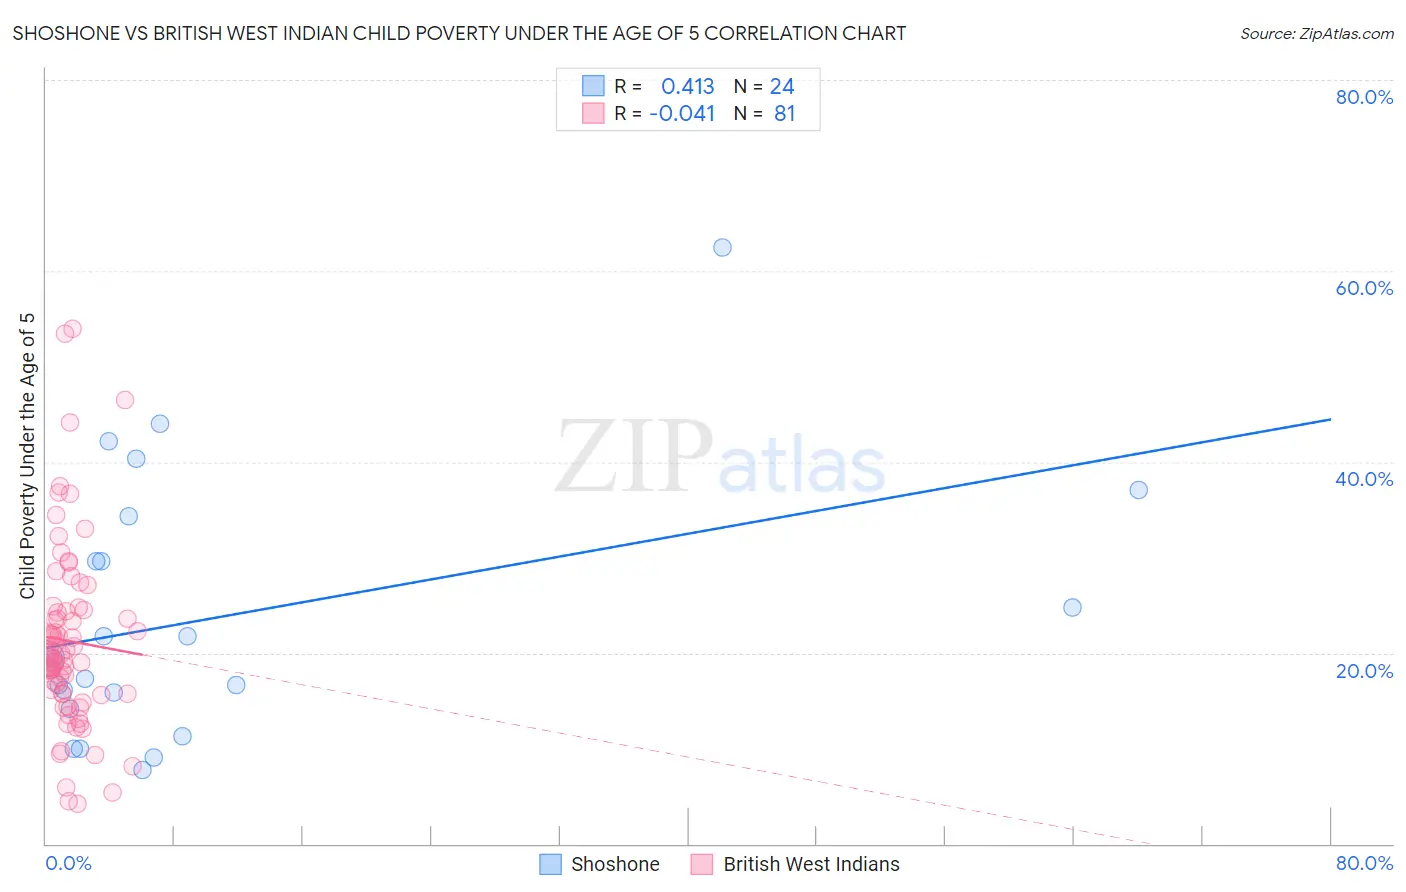
Shoshone vs British West Indian Child Poverty Under the Age of 5 Correlation Chart
The statistical analysis conducted on geographies consisting of 66,129,328 people shows a moderate positive correlation between the proportion of Shoshone and poverty level among children under the age of 5 in the United States with a correlation coefficient (R) of 0.413 and weighted average of 20.0%. Similarly, the statistical analysis conducted on geographies consisting of 150,575,514 people shows no correlation between the proportion of British West Indians and poverty level among children under the age of 5 in the United States with a correlation coefficient (R) of -0.041 and weighted average of 21.4%, a difference of 7.3%.
Child Poverty Under the Age of 5 Correlation Summary
| Measurement | Shoshone | British West Indian |
| Minimum | 7.7% | 4.1% |
| Maximum | 62.5% | 53.9% |
| Range | 54.8% | 49.8% |
| Mean | 23.8% | 21.2% |
| Median | 19.4% | 19.5% |
| Interquartile 25% (IQ1) | 15.0% | 15.7% |
| Interquartile 75% (IQ3) | 32.0% | 24.4% |
| Interquartile Range (IQR) | 17.0% | 8.7% |
| Standard Deviation (Sample) | 13.7% | 9.7% |
| Standard Deviation (Population) | 13.4% | 9.6% |
Similar Demographics by Child Poverty Under the Age of 5
Demographics Similar to Shoshone by Child Poverty Under the Age of 5
In terms of child poverty under the age of 5, the demographic groups most similar to Shoshone are Immigrants from Barbados (20.0%, a difference of 0.010%), Immigrants from St. Vincent and the Grenadines (20.0%, a difference of 0.14%), Immigrants from El Salvador (20.0%, a difference of 0.16%), Immigrants from Cuba (19.9%, a difference of 0.23%), and Fijian (19.9%, a difference of 0.33%).
| Demographics | Rating | Rank | Child Poverty Under the Age of 5 |
| Immigrants | Nonimmigrants | 0.4 /100 | #250 | Tragic 19.7% |
| Pennsylvania Germans | 0.3 /100 | #251 | Tragic 19.8% |
| Immigrants | Nicaragua | 0.3 /100 | #252 | Tragic 19.8% |
| Mexican American Indians | 0.3 /100 | #253 | Tragic 19.9% |
| Fijians | 0.3 /100 | #254 | Tragic 19.9% |
| Immigrants | Cuba | 0.2 /100 | #255 | Tragic 19.9% |
| Immigrants | Barbados | 0.2 /100 | #256 | Tragic 20.0% |
| Shoshone | 0.2 /100 | #257 | Tragic 20.0% |
| Immigrants | St. Vincent and the Grenadines | 0.2 /100 | #258 | Tragic 20.0% |
| Immigrants | El Salvador | 0.2 /100 | #259 | Tragic 20.0% |
| Spanish Americans | 0.2 /100 | #260 | Tragic 20.1% |
| Immigrants | Bangladesh | 0.2 /100 | #261 | Tragic 20.1% |
| Liberians | 0.1 /100 | #262 | Tragic 20.2% |
| Barbadians | 0.1 /100 | #263 | Tragic 20.2% |
| Immigrants | Liberia | 0.1 /100 | #264 | Tragic 20.2% |
Demographics Similar to British West Indians by Child Poverty Under the Age of 5
In terms of child poverty under the age of 5, the demographic groups most similar to British West Indians are Immigrants from Caribbean (21.4%, a difference of 0.17%), Immigrants from Haiti (21.3%, a difference of 0.58%), Immigrants from Somalia (21.6%, a difference of 0.60%), Immigrants from Senegal (21.3%, a difference of 0.65%), and Immigrants from Zaire (21.3%, a difference of 0.82%).
| Demographics | Rating | Rank | Child Poverty Under the Age of 5 |
| Somalis | 0.0 /100 | #284 | Tragic 21.1% |
| Haitians | 0.0 /100 | #285 | Tragic 21.2% |
| Immigrants | Latin America | 0.0 /100 | #286 | Tragic 21.2% |
| Immigrants | Zaire | 0.0 /100 | #287 | Tragic 21.3% |
| Immigrants | Senegal | 0.0 /100 | #288 | Tragic 21.3% |
| Immigrants | Haiti | 0.0 /100 | #289 | Tragic 21.3% |
| Immigrants | Caribbean | 0.0 /100 | #290 | Tragic 21.4% |
| British West Indians | 0.0 /100 | #291 | Tragic 21.4% |
| Immigrants | Somalia | 0.0 /100 | #292 | Tragic 21.6% |
| Mexicans | 0.0 /100 | #293 | Tragic 21.6% |
| Guatemalans | 0.0 /100 | #294 | Tragic 21.6% |
| Cherokee | 0.0 /100 | #295 | Tragic 21.7% |
| Yaqui | 0.0 /100 | #296 | Tragic 21.7% |
| Hispanics or Latinos | 0.0 /100 | #297 | Tragic 21.7% |
| Blackfeet | 0.0 /100 | #298 | Tragic 21.8% |