Yugoslavian vs British West Indian Child Poverty Under the Age of 5
COMPARE
Yugoslavian
British West Indian
Child Poverty Under the Age of 5
Child Poverty Under the Age of 5 Comparison
Yugoslavians
British West Indians
17.2%
CHILD POVERTY UNDER THE AGE OF 5
54.1/ 100
METRIC RATING
172nd/ 347
METRIC RANK
21.4%
CHILD POVERTY UNDER THE AGE OF 5
0.0/ 100
METRIC RATING
291st/ 347
METRIC RANK
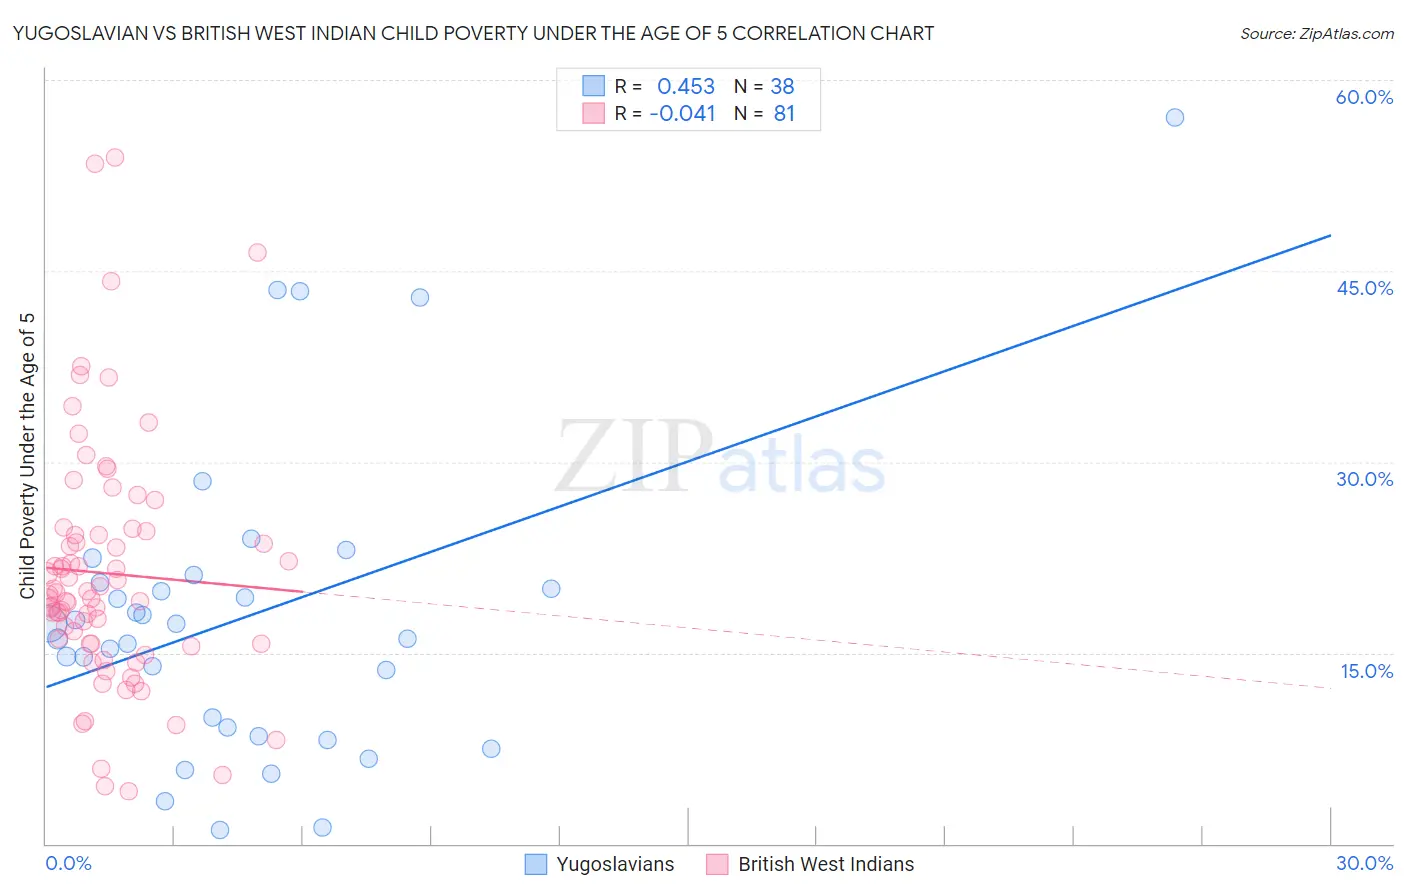
Yugoslavian vs British West Indian Child Poverty Under the Age of 5 Correlation Chart
The statistical analysis conducted on geographies consisting of 276,797,042 people shows a moderate positive correlation between the proportion of Yugoslavians and poverty level among children under the age of 5 in the United States with a correlation coefficient (R) of 0.453 and weighted average of 17.2%. Similarly, the statistical analysis conducted on geographies consisting of 150,575,514 people shows no correlation between the proportion of British West Indians and poverty level among children under the age of 5 in the United States with a correlation coefficient (R) of -0.041 and weighted average of 21.4%, a difference of 24.9%.
Child Poverty Under the Age of 5 Correlation Summary
| Measurement | Yugoslavian | British West Indian |
| Minimum | 1.0% | 4.1% |
| Maximum | 57.0% | 53.9% |
| Range | 56.0% | 49.8% |
| Mean | 17.9% | 21.2% |
| Median | 16.7% | 19.5% |
| Interquartile 25% (IQ1) | 9.1% | 15.7% |
| Interquartile 75% (IQ3) | 20.5% | 24.4% |
| Interquartile Range (IQR) | 11.4% | 8.7% |
| Standard Deviation (Sample) | 12.1% | 9.7% |
| Standard Deviation (Population) | 11.9% | 9.6% |
Similar Demographics by Child Poverty Under the Age of 5
Demographics Similar to Yugoslavians by Child Poverty Under the Age of 5
In terms of child poverty under the age of 5, the demographic groups most similar to Yugoslavians are Welsh (17.2%, a difference of 0.010%), Immigrants from Saudi Arabia (17.2%, a difference of 0.43%), Immigrants from Morocco (17.1%, a difference of 0.51%), Immigrants from Western Asia (17.1%, a difference of 0.54%), and Immigrants from South America (17.1%, a difference of 0.63%).
| Demographics | Rating | Rank | Child Poverty Under the Age of 5 |
| Immigrants | Colombia | 66.9 /100 | #165 | Good 16.9% |
| Slavs | 64.0 /100 | #166 | Good 17.0% |
| Immigrants | Uzbekistan | 62.0 /100 | #167 | Good 17.0% |
| Uruguayans | 60.5 /100 | #168 | Good 17.0% |
| Immigrants | South America | 60.0 /100 | #169 | Good 17.1% |
| Immigrants | Western Asia | 59.2 /100 | #170 | Average 17.1% |
| Immigrants | Morocco | 58.9 /100 | #171 | Average 17.1% |
| Yugoslavians | 54.1 /100 | #172 | Average 17.2% |
| Welsh | 54.0 /100 | #173 | Average 17.2% |
| Immigrants | Saudi Arabia | 50.0 /100 | #174 | Average 17.2% |
| Immigrants | Lebanon | 47.6 /100 | #175 | Average 17.3% |
| Immigrants | Iraq | 45.2 /100 | #176 | Average 17.3% |
| Immigrants | Sierra Leone | 43.6 /100 | #177 | Average 17.3% |
| Immigrants | Cameroon | 42.7 /100 | #178 | Average 17.4% |
| Hawaiians | 41.5 /100 | #179 | Average 17.4% |
Demographics Similar to British West Indians by Child Poverty Under the Age of 5
In terms of child poverty under the age of 5, the demographic groups most similar to British West Indians are Immigrants from Caribbean (21.4%, a difference of 0.17%), Immigrants from Haiti (21.3%, a difference of 0.58%), Immigrants from Somalia (21.6%, a difference of 0.60%), Immigrants from Senegal (21.3%, a difference of 0.65%), and Immigrants from Zaire (21.3%, a difference of 0.82%).
| Demographics | Rating | Rank | Child Poverty Under the Age of 5 |
| Somalis | 0.0 /100 | #284 | Tragic 21.1% |
| Haitians | 0.0 /100 | #285 | Tragic 21.2% |
| Immigrants | Latin America | 0.0 /100 | #286 | Tragic 21.2% |
| Immigrants | Zaire | 0.0 /100 | #287 | Tragic 21.3% |
| Immigrants | Senegal | 0.0 /100 | #288 | Tragic 21.3% |
| Immigrants | Haiti | 0.0 /100 | #289 | Tragic 21.3% |
| Immigrants | Caribbean | 0.0 /100 | #290 | Tragic 21.4% |
| British West Indians | 0.0 /100 | #291 | Tragic 21.4% |
| Immigrants | Somalia | 0.0 /100 | #292 | Tragic 21.6% |
| Mexicans | 0.0 /100 | #293 | Tragic 21.6% |
| Guatemalans | 0.0 /100 | #294 | Tragic 21.6% |
| Cherokee | 0.0 /100 | #295 | Tragic 21.7% |
| Yaqui | 0.0 /100 | #296 | Tragic 21.7% |
| Hispanics or Latinos | 0.0 /100 | #297 | Tragic 21.7% |
| Blackfeet | 0.0 /100 | #298 | Tragic 21.8% |