Shoshone vs Immigrants from Portugal Child Poverty Under the Age of 5

COMPARE

Shoshone
Race
Ancestry
AfghanAfricanAlaska NativeAlaskan AthabascanAlbanianAleutAlsatianAmericanApacheArabArapahoArgentineanArmenianAssyrian/Chaldean/SyriacAustralianAustrianBahamianBangladeshiBarbadianBasqueBelgianBelizeanBermudanBhutaneseBlackfeetBolivianBrazilianBritishBritish West IndianBulgarianBurmeseCajunCambodianCanadianCape VerdeanCarpatho RusynCelticCentral AmericanCentral American IndianCherokeeCheyenneChickasawChileanChineseChippewaChoctawColombianColvilleComancheCosta RicanCreeCreekCroatianCrowCubanCypriotCzechCzechoslovakianDanishDelawareDominicanDutchDutch West IndianEastern EuropeanEcuadorianEgyptianEnglishEstonianEthiopianEuropeanFijianFilipinoFinnishFrenchFrench American IndianFrench CanadianGermanGerman RussianGhanaianGreekGuamanian/ChamorroGuatemalanGuyaneseHaitianHmongHonduranHopiHoumaHungarianIcelanderIndian (Asian)IndonesianInupiatIranianIraqiIrishIroquoisIsraeliItalianJamaicanJapaneseJordanianKenyanKiowaKoreanLaotianLatvianLebaneseLiberianLithuanianLumbeeLuxembourgerMacedonianMalaysianMalteseMarshalleseMenomineeMexicanMexican American IndianMongolianMoroccanNative HawaiianNavajoNepaleseNew ZealanderNicaraguanNigerianNorthern EuropeanNorwegianOkinawanOsageOttawaPaiutePakistaniPalestinianPanamanianParaguayanPennsylvania GermanPeruvianPimaPolishPortuguesePotawatomiPuebloPuerto RicanPuget Sound SalishRomanianRussianSalvadoranSamoanScandinavianScotch-IrishScottishSeminoleSenegaleseSerbianShoshoneSierra LeoneanSiouxSlavicSlovakSloveneSomaliSouth AfricanSouth AmericanSouth American IndianSoviet UnionSpaniardSpanishSpanish AmericanSpanish American IndianSri LankanSubsaharan AfricanSudaneseSwedishSwissSyrianTaiwaneseThaiTlingit-HaidaTohono O'OdhamTonganTrinidadian and TobagonianTsimshianTurkishU.S. Virgin IslanderUgandanUkrainianUruguayanUteVenezuelanVietnameseWelshWest IndianYakamaYaquiYugoslavianYumanYup'ikZimbabwean
Immigration
NonimmigrantsImmigrantsAfghanistanAfricaAlbaniaArgentinaArmeniaAsiaAustraliaAustriaBahamasBangladeshBarbadosBelarusBelgiumBelizeBoliviaBosnia and HerzegovinaBrazilBulgariaBurma/MyanmarCabo VerdeCambodiaCameroonCanadaCaribbeanCentral AmericaChileChinaColombiaCongoCosta RicaCroatiaCubaCzechoslovakiaDenmarkDominicaDominican RepublicEastern AfricaEastern AsiaEastern EuropeEcuadorEgyptEl SalvadorEnglandEritreaEthiopiaEuropeFijiFranceGermanyGhanaGreeceGrenadaGuatemalaGuyanaHaitiHondurasHong KongHungaryIndiaIndonesiaIranIraqIrelandIsraelItalyJamaicaJapanJordanKazakhstanKenyaKoreaKuwaitLaosLatin AmericaLatviaLebanonLiberiaLithuaniaMalaysiaMexicoMicronesiaMiddle AfricaMoldovaMoroccoNepalNetherlandsNicaraguaNigeriaNorth AmericaNorth MacedoniaNorthern AfricaNorthern EuropeNorwayOceaniaPakistanPanamaPeruPhilippinesPolandRomaniaRussiaSaudi ArabiaScotlandSenegalSerbiaSierra LeoneSingaporeSomaliaSouth AfricaSouth AmericaSouth Central AsiaSouth Eastern AsiaSouthern EuropeSpainSri LankaSt. Vincent and the GrenadinesSudanSwedenSwitzerlandSyriaTaiwanThailandTrinidad and TobagoTurkeyUgandaUkraineUruguayUzbekistanVenezuelaVietnamWest IndiesWestern AfricaWestern AsiaWestern EuropeYemenZaireZimbabweAzores
Immigrants from Portugal
Race
Ancestry
AfghanAfricanAlaska NativeAlaskan AthabascanAlbanianAleutAlsatianAmericanApacheArabArapahoArgentineanArmenianAssyrian/Chaldean/SyriacAustralianAustrianBahamianBangladeshiBarbadianBasqueBelgianBelizeanBermudanBhutaneseBlackfeetBolivianBrazilianBritishBritish West IndianBulgarianBurmeseCajunCambodianCanadianCape VerdeanCarpatho RusynCelticCentral AmericanCentral American IndianCherokeeCheyenneChickasawChileanChineseChippewaChoctawColombianColvilleComancheCosta RicanCreeCreekCroatianCrowCubanCypriotCzechCzechoslovakianDanishDelawareDominicanDutchDutch West IndianEastern EuropeanEcuadorianEgyptianEnglishEstonianEthiopianEuropeanFijianFilipinoFinnishFrenchFrench American IndianFrench CanadianGermanGerman RussianGhanaianGreekGuamanian/ChamorroGuatemalanGuyaneseHaitianHmongHonduranHopiHoumaHungarianIcelanderIndian (Asian)IndonesianInupiatIranianIraqiIrishIroquoisIsraeliItalianJamaicanJapaneseJordanianKenyanKiowaKoreanLaotianLatvianLebaneseLiberianLithuanianLumbeeLuxembourgerMacedonianMalaysianMalteseMarshalleseMenomineeMexicanMexican American IndianMongolianMoroccanNative HawaiianNavajoNepaleseNew ZealanderNicaraguanNigerianNorthern EuropeanNorwegianOkinawanOsageOttawaPaiutePakistaniPalestinianPanamanianParaguayanPennsylvania GermanPeruvianPimaPolishPortuguesePotawatomiPuebloPuerto RicanPuget Sound SalishRomanianRussianSalvadoranSamoanScandinavianScotch-IrishScottishSeminoleSenegaleseSerbianSierra LeoneanSiouxSlavicSlovakSloveneSomaliSouth AfricanSouth AmericanSouth American IndianSoviet UnionSpaniardSpanishSpanish AmericanSpanish American IndianSri LankanSubsaharan AfricanSudaneseSwedishSwissSyrianTaiwaneseThaiTlingit-HaidaTohono O'OdhamTonganTrinidadian and TobagonianTsimshianTurkishU.S. Virgin IslanderUgandanUkrainianUruguayanUteVenezuelanVietnameseWelshWest IndianYakamaYaquiYugoslavianYumanYup'ikZimbabwean
Immigration
NonimmigrantsImmigrantsAfghanistanAfricaAlbaniaArgentinaArmeniaAsiaAustraliaAustriaBahamasBangladeshBarbadosBelarusBelgiumBelizeBoliviaBosnia and HerzegovinaBrazilBulgariaBurma/MyanmarCabo VerdeCambodiaCameroonCanadaCaribbeanCentral AmericaChileChinaColombiaCongoCosta RicaCroatiaCubaCzechoslovakiaDenmarkDominicaDominican RepublicEastern AfricaEastern AsiaEastern EuropeEcuadorEgyptEl SalvadorEnglandEritreaEthiopiaEuropeFijiFranceGermanyGhanaGreeceGrenadaGuatemalaGuyanaHaitiHondurasHong KongHungaryIndiaIndonesiaIranIraqIrelandIsraelItalyJamaicaJapanJordanKazakhstanKenyaKoreaKuwaitLaosLatin AmericaLatviaLebanonLiberiaLithuaniaMalaysiaMexicoMicronesiaMiddle AfricaMoldovaMoroccoNepalNetherlandsNicaraguaNigeriaNorth AmericaNorth MacedoniaNorthern AfricaNorthern EuropeNorwayOceaniaPakistanPanamaPeruPhilippinesPolandPortugalRomaniaRussiaSaudi ArabiaScotlandSenegalSerbiaSierra LeoneSingaporeSomaliaSouth AfricaSouth AmericaSouth Central AsiaSouth Eastern AsiaSouthern EuropeSpainSri LankaSt. Vincent and the GrenadinesSudanSwedenSwitzerlandSyriaTaiwanThailandTrinidad and TobagoTurkeyUgandaUkraineUruguayUzbekistanVenezuelaVietnamWest IndiesWestern AfricaWestern AsiaWestern EuropeYemenZaireZimbabweAzores
Child Poverty Under the Age of 5
Income
Poverty
Unemployment
Labor Participation
Family Structure
Vehicle Availability
Education Level
Disability

Child Poverty Under the Age of 5 Comparison

Shoshone

Immigrants from Portugal

Tragic
Fair
20.0%
CHILD POVERTY UNDER THE AGE OF 5
0.2/ 100
METRIC RATING
257th/ 347
METRIC RANK
17.8%
CHILD POVERTY UNDER THE AGE OF 5
22.2/ 100
METRIC RATING
196th/ 347
METRIC RANK

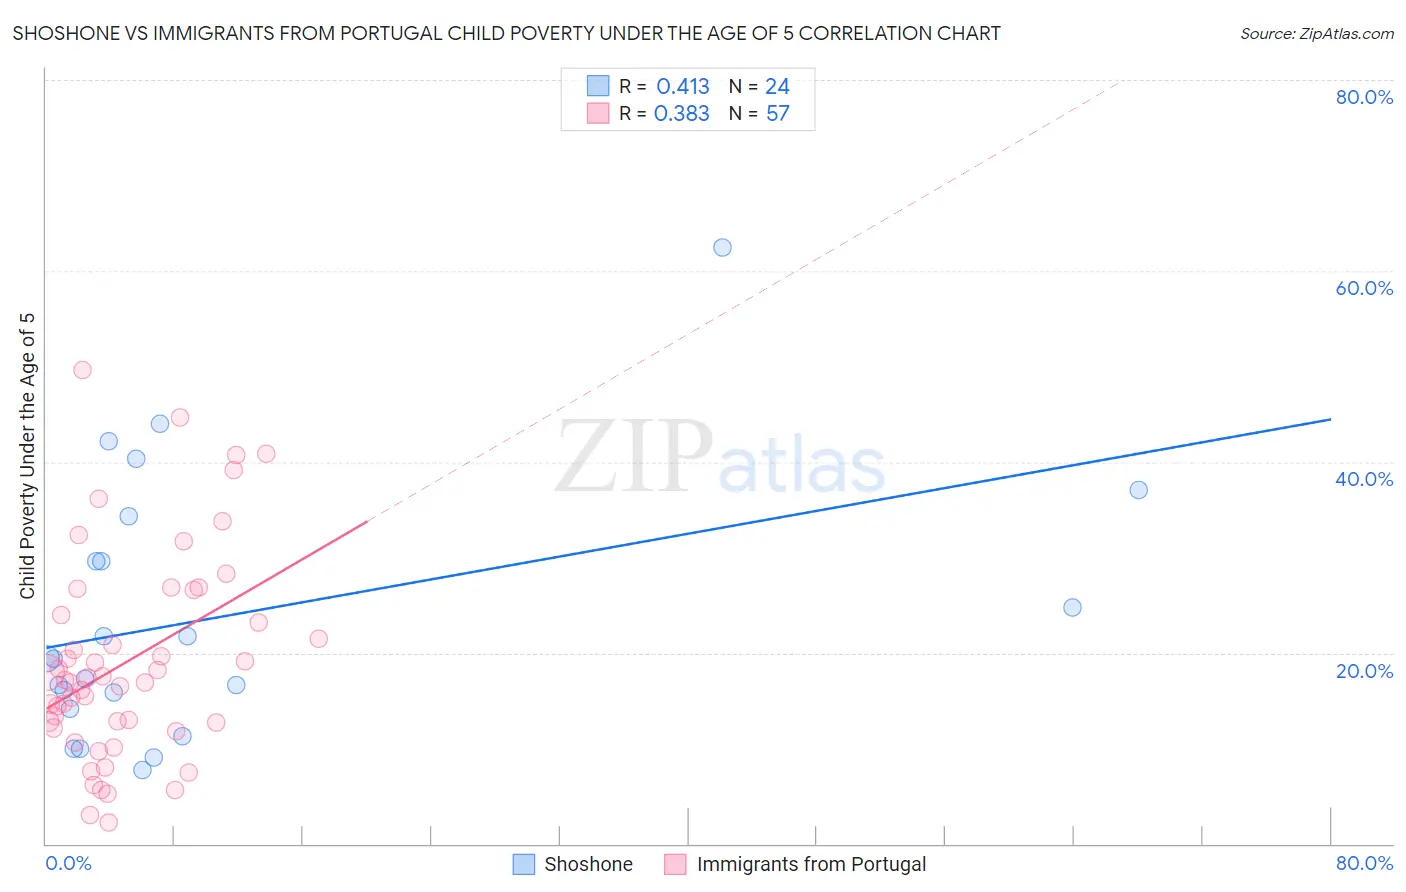
Shoshone vs Immigrants from Portugal Child Poverty Under the Age of 5 Correlation Chart

The statistical analysis conducted on geographies consisting of 66,129,328 people shows a moderate positive correlation between the proportion of Shoshone and poverty level among children under the age of 5 in the United States with a correlation coefficient (R) of 0.413 and weighted average of 20.0%. Similarly, the statistical analysis conducted on geographies consisting of 168,608,653 people shows a mild positive correlation between the proportion of Immigrants from Portugal and poverty level among children under the age of 5 in the United States with a correlation coefficient (R) of 0.383 and weighted average of 17.8%, a difference of 12.2%.
Shoshone vs Immigrants from Portugal Child Poverty Under the Age of 5

Child Poverty Under the Age of 5 Correlation Summary

MeasurementShoshoneImmigrants from Portugal
Minimum7.7%2.2%
Maximum62.5%49.6%
Range54.8%47.4%
Mean23.8%19.1%
Median19.4%17.1%
Interquartile 25% (IQ1)15.0%12.4%
Interquartile 75% (IQ3)32.0%25.2%
Interquartile Range (IQR)17.0%12.8%
Standard Deviation (Sample)13.7%10.7%
Standard Deviation (Population)13.4%10.6%

Similar Demographics by Child Poverty Under the Age of 5

Demographics Similar to Shoshone by Child Poverty Under the Age of 5

In terms of child poverty under the age of 5, the demographic groups most similar to Shoshone are Immigrants from Barbados (20.0%, a difference of 0.010%), Immigrants from St. Vincent and the Grenadines (20.0%, a difference of 0.14%), Immigrants from El Salvador (20.0%, a difference of 0.16%), Immigrants from Cuba (19.9%, a difference of 0.23%), and Fijian (19.9%, a difference of 0.33%).
DemographicsRating | RankChild Poverty Under the Age of 5
Immigrants | Nonimmigrants
0.4
/100
|
#250
Tragic
19.7%
Pennsylvania Germans
0.3
/100
|
#251
Tragic
19.8%
Immigrants | Nicaragua
0.3
/100
|
#252
Tragic
19.8%
Mexican American Indians
0.3
/100
|
#253
Tragic
19.9%
Fijians
0.3
/100
|
#254
Tragic
19.9%
Immigrants | Cuba
0.2
/100
|
#255
Tragic
19.9%
Immigrants | Barbados
0.2
/100
|
#256
Tragic
20.0%
Shoshone
0.2
/100
|
#257
Tragic
20.0%
Immigrants | St. Vincent and the Grenadines
0.2
/100
|
#258
Tragic
20.0%
Immigrants | El Salvador
0.2
/100
|
#259
Tragic
20.0%
Spanish Americans
0.2
/100
|
#260
Tragic
20.1%
Immigrants | Bangladesh
0.2
/100
|
#261
Tragic
20.1%
Liberians
0.1
/100
|
#262
Tragic
20.2%
Barbadians
0.1
/100
|
#263
Tragic
20.2%
Immigrants | Liberia
0.1
/100
|
#264
Tragic
20.2%

Demographics Similar to Immigrants from Portugal by Child Poverty Under the Age of 5

In terms of child poverty under the age of 5, the demographic groups most similar to Immigrants from Portugal are Sierra Leonean (17.7%, a difference of 0.27%), Immigrants from Kenya (17.9%, a difference of 0.33%), French Canadian (17.7%, a difference of 0.34%), Immigrants from Uganda (17.7%, a difference of 0.39%), and Celtic (17.9%, a difference of 0.60%).
DemographicsRating | RankChild Poverty Under the Age of 5
French
33.6
/100
|
#189
Fair
17.5%
Slovaks
29.2
/100
|
#190
Fair
17.6%
Immigrants | Afghanistan
27.9
/100
|
#191
Fair
17.7%
Immigrants | Uruguay
27.8
/100
|
#192
Fair
17.7%
Immigrants | Uganda
25.0
/100
|
#193
Fair
17.7%
French Canadians
24.6
/100
|
#194
Fair
17.7%
Sierra Leoneans
24.1
/100
|
#195
Fair
17.7%
Immigrants | Portugal
22.2
/100
|
#196
Fair
17.8%
Immigrants | Kenya
20.0
/100
|
#197
Fair
17.9%
Celtics
18.3
/100
|
#198
Poor
17.9%
Hungarians
18.3
/100
|
#199
Poor
17.9%
Iraqis
14.0
/100
|
#200
Poor
18.0%
Ugandans
13.9
/100
|
#201
Poor
18.0%
Japanese
13.8
/100
|
#202
Poor
18.1%
Immigrants | Cambodia
13.7
/100
|
#203
Poor
18.1%