Korean vs British West Indian Child Poverty Under the Age of 5
COMPARE
Korean
British West Indian
Child Poverty Under the Age of 5
Child Poverty Under the Age of 5 Comparison
Koreans
British West Indians
14.4%
CHILD POVERTY UNDER THE AGE OF 5
99.8/ 100
METRIC RATING
31st/ 347
METRIC RANK
21.4%
CHILD POVERTY UNDER THE AGE OF 5
0.0/ 100
METRIC RATING
291st/ 347
METRIC RANK
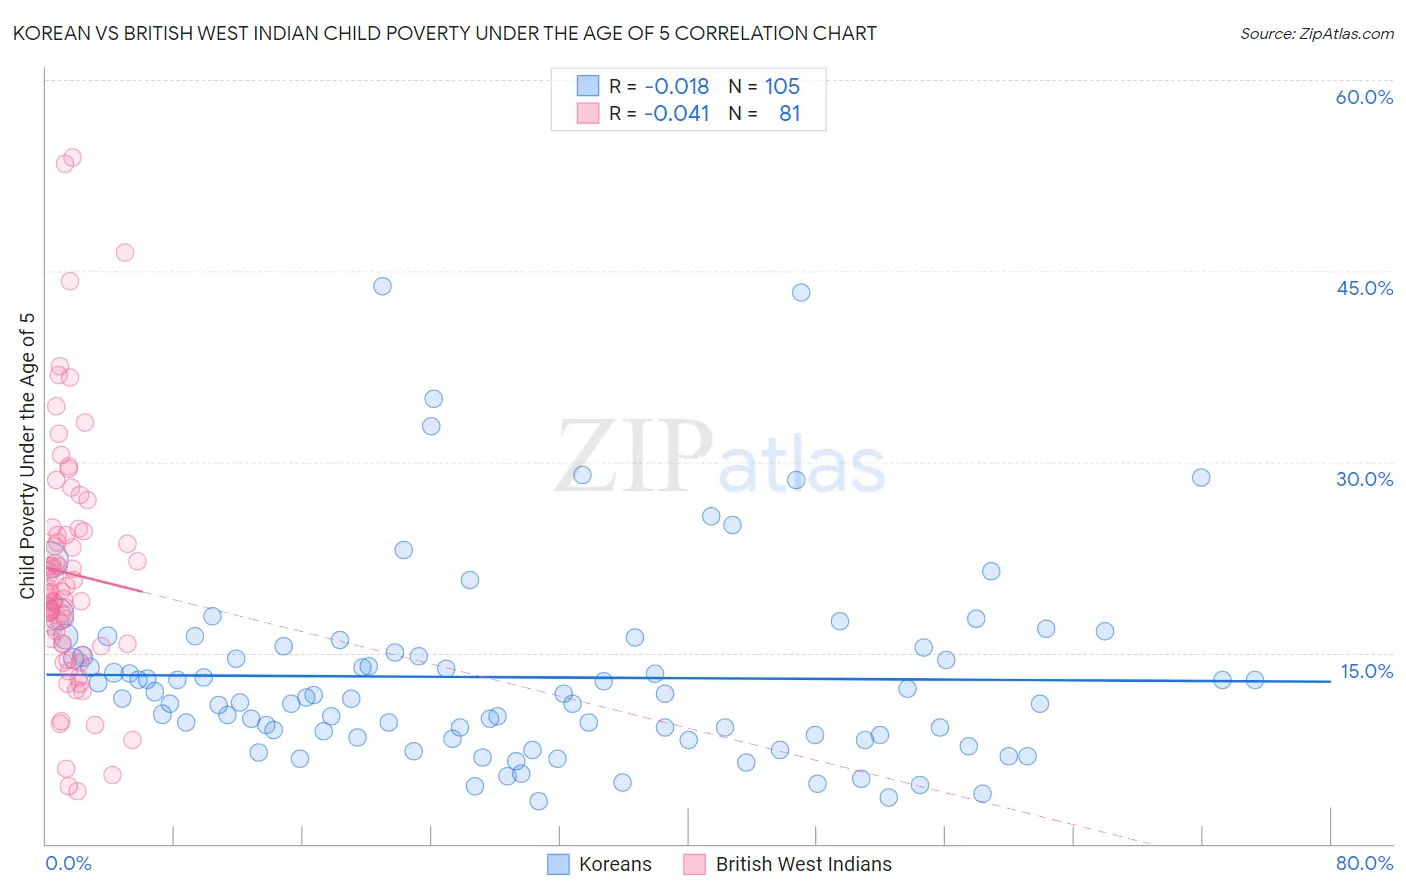
Korean vs British West Indian Child Poverty Under the Age of 5 Correlation Chart
The statistical analysis conducted on geographies consisting of 483,948,585 people shows no correlation between the proportion of Koreans and poverty level among children under the age of 5 in the United States with a correlation coefficient (R) of -0.018 and weighted average of 14.4%. Similarly, the statistical analysis conducted on geographies consisting of 150,575,514 people shows no correlation between the proportion of British West Indians and poverty level among children under the age of 5 in the United States with a correlation coefficient (R) of -0.041 and weighted average of 21.4%, a difference of 48.8%.
Child Poverty Under the Age of 5 Correlation Summary
| Measurement | Korean | British West Indian |
| Minimum | 3.3% | 4.1% |
| Maximum | 43.8% | 53.9% |
| Range | 40.5% | 49.8% |
| Mean | 13.1% | 21.2% |
| Median | 11.4% | 19.5% |
| Interquartile 25% (IQ1) | 8.5% | 15.7% |
| Interquartile 75% (IQ3) | 15.2% | 24.4% |
| Interquartile Range (IQR) | 6.7% | 8.7% |
| Standard Deviation (Sample) | 7.5% | 9.7% |
| Standard Deviation (Population) | 7.5% | 9.6% |
Similar Demographics by Child Poverty Under the Age of 5
Demographics Similar to Koreans by Child Poverty Under the Age of 5
In terms of child poverty under the age of 5, the demographic groups most similar to Koreans are Cambodian (14.4%, a difference of 0.030%), Immigrants from Asia (14.4%, a difference of 0.080%), Immigrants from Sri Lanka (14.4%, a difference of 0.28%), Immigrants from Indonesia (14.3%, a difference of 0.47%), and Taiwanese (14.5%, a difference of 0.58%).
| Demographics | Rating | Rank | Child Poverty Under the Age of 5 |
| Asians | 99.9 /100 | #24 | Exceptional 14.0% |
| Cypriots | 99.9 /100 | #25 | Exceptional 14.0% |
| Immigrants | Lithuania | 99.9 /100 | #26 | Exceptional 14.1% |
| Tongans | 99.9 /100 | #27 | Exceptional 14.2% |
| Immigrants | Indonesia | 99.8 /100 | #28 | Exceptional 14.3% |
| Immigrants | Asia | 99.8 /100 | #29 | Exceptional 14.4% |
| Cambodians | 99.8 /100 | #30 | Exceptional 14.4% |
| Koreans | 99.8 /100 | #31 | Exceptional 14.4% |
| Immigrants | Sri Lanka | 99.8 /100 | #32 | Exceptional 14.4% |
| Taiwanese | 99.8 /100 | #33 | Exceptional 14.5% |
| Immigrants | Moldova | 99.8 /100 | #34 | Exceptional 14.5% |
| Latvians | 99.8 /100 | #35 | Exceptional 14.5% |
| Maltese | 99.8 /100 | #36 | Exceptional 14.5% |
| Turks | 99.7 /100 | #37 | Exceptional 14.6% |
| Eastern Europeans | 99.7 /100 | #38 | Exceptional 14.6% |
Demographics Similar to British West Indians by Child Poverty Under the Age of 5
In terms of child poverty under the age of 5, the demographic groups most similar to British West Indians are Immigrants from Caribbean (21.4%, a difference of 0.17%), Immigrants from Haiti (21.3%, a difference of 0.58%), Immigrants from Somalia (21.6%, a difference of 0.60%), Immigrants from Senegal (21.3%, a difference of 0.65%), and Immigrants from Zaire (21.3%, a difference of 0.82%).
| Demographics | Rating | Rank | Child Poverty Under the Age of 5 |
| Somalis | 0.0 /100 | #284 | Tragic 21.1% |
| Haitians | 0.0 /100 | #285 | Tragic 21.2% |
| Immigrants | Latin America | 0.0 /100 | #286 | Tragic 21.2% |
| Immigrants | Zaire | 0.0 /100 | #287 | Tragic 21.3% |
| Immigrants | Senegal | 0.0 /100 | #288 | Tragic 21.3% |
| Immigrants | Haiti | 0.0 /100 | #289 | Tragic 21.3% |
| Immigrants | Caribbean | 0.0 /100 | #290 | Tragic 21.4% |
| British West Indians | 0.0 /100 | #291 | Tragic 21.4% |
| Immigrants | Somalia | 0.0 /100 | #292 | Tragic 21.6% |
| Mexicans | 0.0 /100 | #293 | Tragic 21.6% |
| Guatemalans | 0.0 /100 | #294 | Tragic 21.6% |
| Cherokee | 0.0 /100 | #295 | Tragic 21.7% |
| Yaqui | 0.0 /100 | #296 | Tragic 21.7% |
| Hispanics or Latinos | 0.0 /100 | #297 | Tragic 21.7% |
| Blackfeet | 0.0 /100 | #298 | Tragic 21.8% |