Serbian vs Immigrants from Poland Single Mother Poverty
COMPARE
Serbian
Immigrants from Poland
Single Mother Poverty
Single Mother Poverty Comparison
Serbians
Immigrants from Poland
28.6%
SINGLE MOTHER POVERTY
85.0/ 100
METRIC RATING
149th/ 347
METRIC RANK
26.9%
SINGLE MOTHER POVERTY
99.8/ 100
METRIC RATING
48th/ 347
METRIC RANK
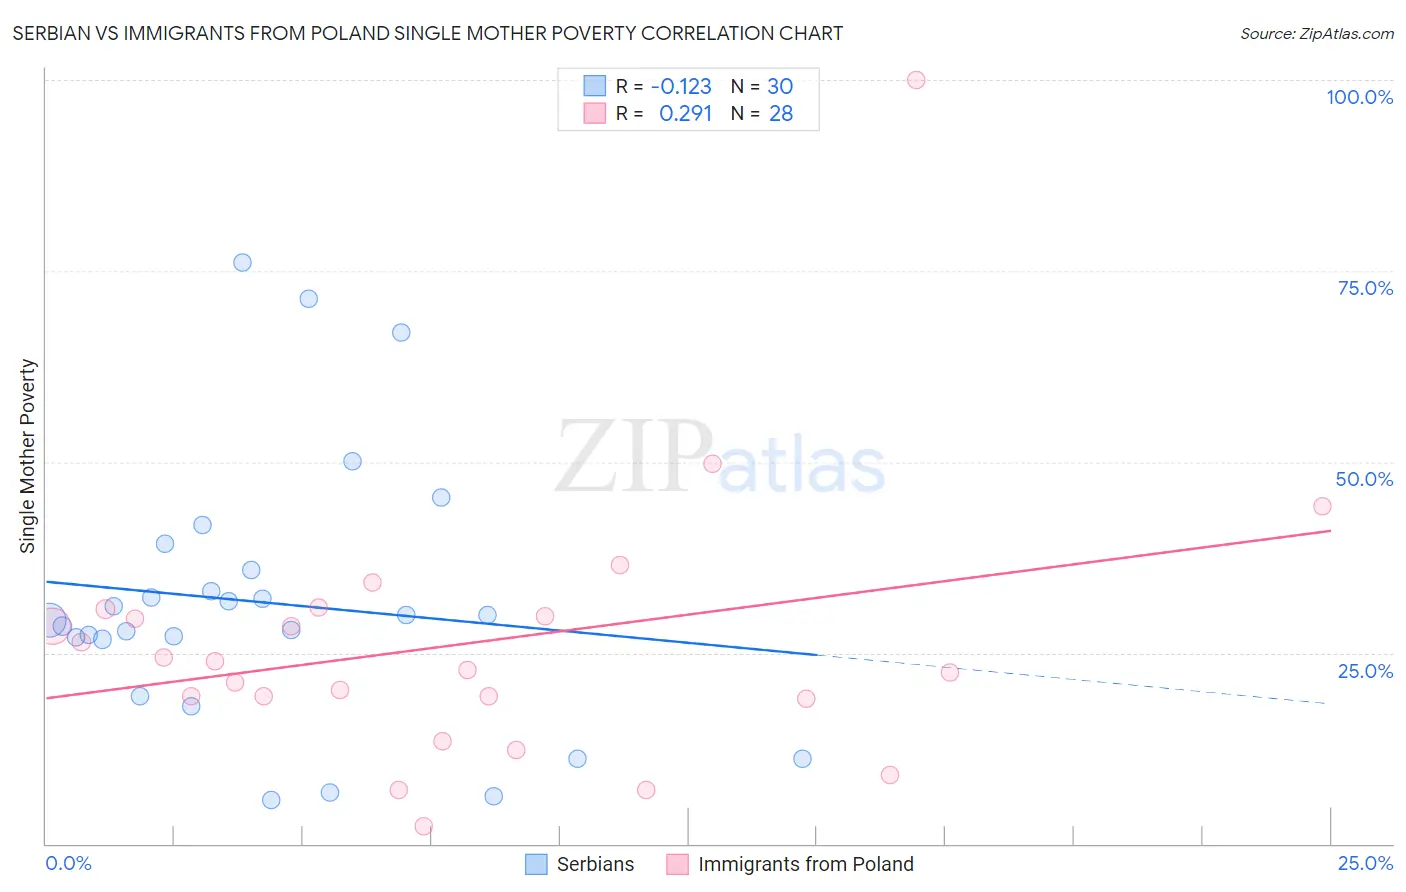
Serbian vs Immigrants from Poland Single Mother Poverty Correlation Chart
The statistical analysis conducted on geographies consisting of 262,198,183 people shows a poor negative correlation between the proportion of Serbians and poverty level among single mothers in the United States with a correlation coefficient (R) of -0.123 and weighted average of 28.6%. Similarly, the statistical analysis conducted on geographies consisting of 296,747,153 people shows a weak positive correlation between the proportion of Immigrants from Poland and poverty level among single mothers in the United States with a correlation coefficient (R) of 0.291 and weighted average of 26.9%, a difference of 6.0%.
Single Mother Poverty Correlation Summary
| Measurement | Serbian | Immigrants from Poland |
| Minimum | 5.8% | 2.2% |
| Maximum | 76.1% | 100.0% |
| Range | 70.4% | 97.8% |
| Mean | 31.6% | 26.1% |
| Median | 29.6% | 23.3% |
| Interquartile 25% (IQ1) | 26.8% | 19.2% |
| Interquartile 75% (IQ3) | 35.8% | 30.2% |
| Interquartile Range (IQR) | 9.0% | 11.1% |
| Standard Deviation (Sample) | 17.4% | 18.1% |
| Standard Deviation (Population) | 17.1% | 17.7% |
Similar Demographics by Single Mother Poverty
Demographics Similar to Serbians by Single Mother Poverty
In terms of single mother poverty, the demographic groups most similar to Serbians are Syrian (28.6%, a difference of 0.020%), Immigrants from Lebanon (28.6%, a difference of 0.030%), Immigrants from Denmark (28.5%, a difference of 0.10%), Immigrants from South America (28.5%, a difference of 0.11%), and Luxembourger (28.5%, a difference of 0.14%).
| Demographics | Rating | Rank | Single Mother Poverty |
| South Africans | 86.6 /100 | #142 | Excellent 28.5% |
| Immigrants | North America | 86.5 /100 | #143 | Excellent 28.5% |
| Luxembourgers | 86.4 /100 | #144 | Excellent 28.5% |
| Immigrants | South America | 86.1 /100 | #145 | Excellent 28.5% |
| Immigrants | Denmark | 86.1 /100 | #146 | Excellent 28.5% |
| Immigrants | Lebanon | 85.3 /100 | #147 | Excellent 28.6% |
| Syrians | 85.3 /100 | #148 | Excellent 28.6% |
| Serbians | 85.0 /100 | #149 | Excellent 28.6% |
| Northern Europeans | 81.7 /100 | #150 | Excellent 28.6% |
| Immigrants | Oceania | 79.9 /100 | #151 | Good 28.7% |
| Austrians | 79.0 /100 | #152 | Good 28.7% |
| Slovenes | 76.4 /100 | #153 | Good 28.8% |
| Portuguese | 73.2 /100 | #154 | Good 28.8% |
| Ugandans | 71.7 /100 | #155 | Good 28.8% |
| Iraqis | 71.5 /100 | #156 | Good 28.8% |
Demographics Similar to Immigrants from Poland by Single Mother Poverty
In terms of single mother poverty, the demographic groups most similar to Immigrants from Poland are Egyptian (26.9%, a difference of 0.080%), Cambodian (27.0%, a difference of 0.080%), Laotian (27.0%, a difference of 0.090%), Immigrants from Serbia (26.9%, a difference of 0.13%), and Latvian (26.9%, a difference of 0.18%).
| Demographics | Rating | Rank | Single Mother Poverty |
| Immigrants | Greece | 99.9 /100 | #41 | Exceptional 26.7% |
| Armenians | 99.9 /100 | #42 | Exceptional 26.8% |
| Tsimshian | 99.9 /100 | #43 | Exceptional 26.8% |
| Immigrants | Sierra Leone | 99.9 /100 | #44 | Exceptional 26.9% |
| Latvians | 99.9 /100 | #45 | Exceptional 26.9% |
| Immigrants | Serbia | 99.9 /100 | #46 | Exceptional 26.9% |
| Egyptians | 99.8 /100 | #47 | Exceptional 26.9% |
| Immigrants | Poland | 99.8 /100 | #48 | Exceptional 26.9% |
| Cambodians | 99.8 /100 | #49 | Exceptional 27.0% |
| Laotians | 99.8 /100 | #50 | Exceptional 27.0% |
| Immigrants | Argentina | 99.7 /100 | #51 | Exceptional 27.1% |
| Immigrants | South Eastern Asia | 99.7 /100 | #52 | Exceptional 27.1% |
| Immigrants | Jordan | 99.7 /100 | #53 | Exceptional 27.1% |
| Immigrants | Bulgaria | 99.7 /100 | #54 | Exceptional 27.1% |
| Immigrants | Egypt | 99.7 /100 | #55 | Exceptional 27.1% |