Serbian vs Immigrants from Nicaragua Child Poverty Under the Age of 16
COMPARE
Serbian
Immigrants from Nicaragua
Child Poverty Under the Age of 16
Child Poverty Under the Age of 16 Comparison
Serbians
Immigrants from Nicaragua
14.8%
CHILD POVERTY UNDER THE AGE OF 16
94.5/ 100
METRIC RATING
106th/ 347
METRIC RANK
18.8%
CHILD POVERTY UNDER THE AGE OF 16
0.4/ 100
METRIC RATING
246th/ 347
METRIC RANK
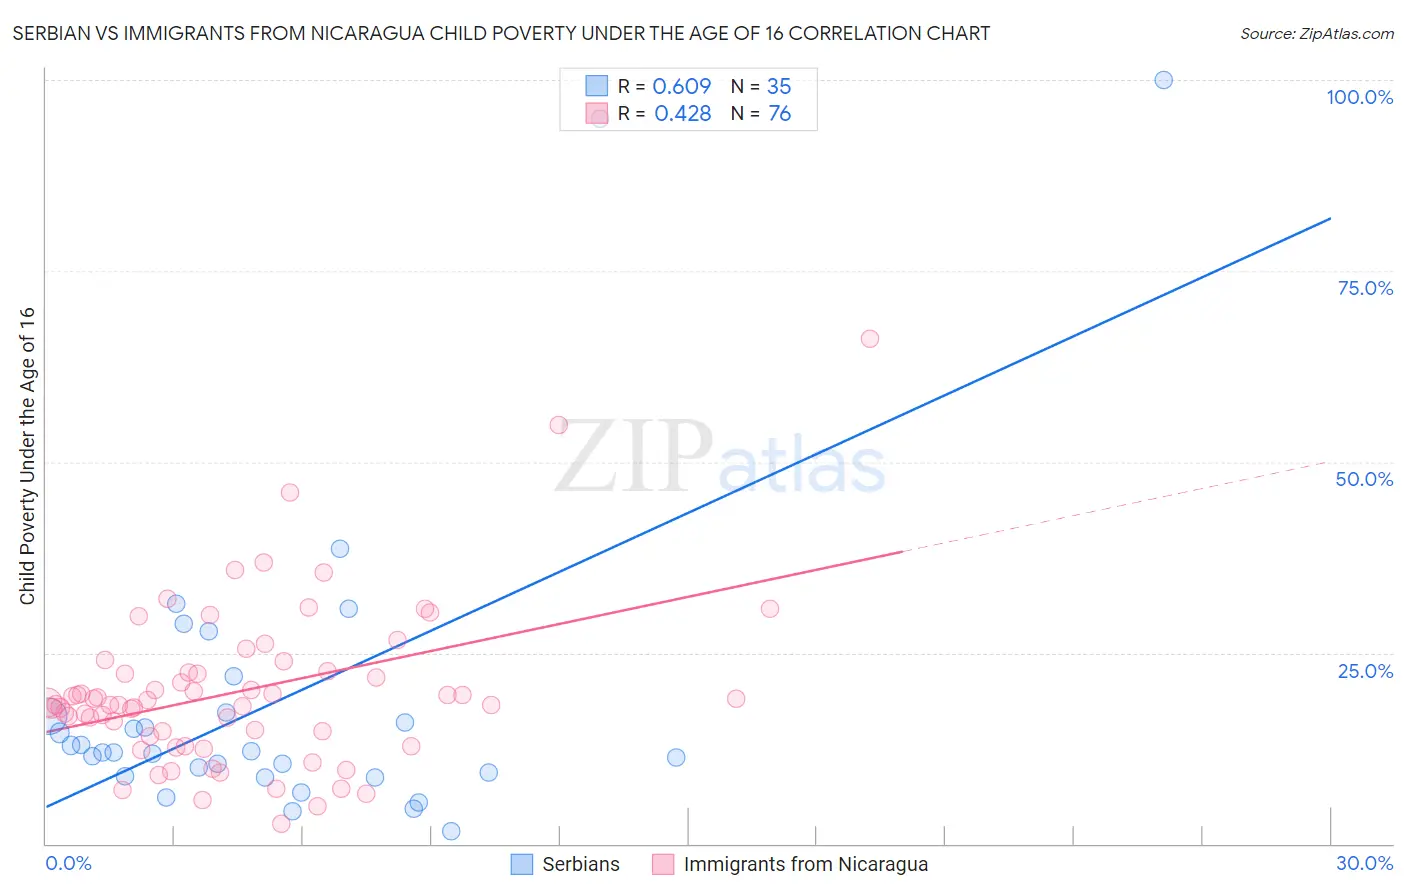
Serbian vs Immigrants from Nicaragua Child Poverty Under the Age of 16 Correlation Chart
The statistical analysis conducted on geographies consisting of 265,642,199 people shows a significant positive correlation between the proportion of Serbians and poverty level among children under the age of 16 in the United States with a correlation coefficient (R) of 0.609 and weighted average of 14.8%. Similarly, the statistical analysis conducted on geographies consisting of 235,832,733 people shows a moderate positive correlation between the proportion of Immigrants from Nicaragua and poverty level among children under the age of 16 in the United States with a correlation coefficient (R) of 0.428 and weighted average of 18.8%, a difference of 27.0%.
Child Poverty Under the Age of 16 Correlation Summary
| Measurement | Serbian | Immigrants from Nicaragua |
| Minimum | 1.6% | 2.6% |
| Maximum | 100.0% | 66.2% |
| Range | 98.4% | 63.6% |
| Mean | 18.9% | 20.0% |
| Median | 12.0% | 18.3% |
| Interquartile 25% (IQ1) | 8.9% | 14.3% |
| Interquartile 75% (IQ3) | 17.2% | 22.5% |
| Interquartile Range (IQR) | 8.4% | 8.1% |
| Standard Deviation (Sample) | 21.4% | 10.5% |
| Standard Deviation (Population) | 21.1% | 10.5% |
Similar Demographics by Child Poverty Under the Age of 16
Demographics Similar to Serbians by Child Poverty Under the Age of 16
In terms of child poverty under the age of 16, the demographic groups most similar to Serbians are Chilean (14.8%, a difference of 0.060%), Basque (14.8%, a difference of 0.13%), Jordanian (14.8%, a difference of 0.15%), Tlingit-Haida (14.9%, a difference of 0.22%), and Immigrants from England (14.8%, a difference of 0.24%).
| Demographics | Rating | Rank | Child Poverty Under the Age of 16 |
| British | 95.5 /100 | #99 | Exceptional 14.7% |
| Dutch | 95.1 /100 | #100 | Exceptional 14.8% |
| Immigrants | Switzerland | 95.1 /100 | #101 | Exceptional 14.8% |
| Romanians | 95.0 /100 | #102 | Exceptional 14.8% |
| Immigrants | Egypt | 94.9 /100 | #103 | Exceptional 14.8% |
| Immigrants | England | 94.8 /100 | #104 | Exceptional 14.8% |
| Basques | 94.7 /100 | #105 | Exceptional 14.8% |
| Serbians | 94.5 /100 | #106 | Exceptional 14.8% |
| Chileans | 94.4 /100 | #107 | Exceptional 14.8% |
| Jordanians | 94.2 /100 | #108 | Exceptional 14.8% |
| Tlingit-Haida | 94.1 /100 | #109 | Exceptional 14.9% |
| English | 93.5 /100 | #110 | Exceptional 14.9% |
| Immigrants | Denmark | 93.5 /100 | #111 | Exceptional 14.9% |
| Irish | 93.4 /100 | #112 | Exceptional 14.9% |
| Belgians | 93.3 /100 | #113 | Exceptional 14.9% |
Demographics Similar to Immigrants from Nicaragua by Child Poverty Under the Age of 16
In terms of child poverty under the age of 16, the demographic groups most similar to Immigrants from Nicaragua are Shoshone (18.8%, a difference of 0.030%), French American Indian (18.9%, a difference of 0.24%), Ecuadorian (19.0%, a difference of 0.67%), Cape Verdean (18.7%, a difference of 0.68%), and Immigrants from Cuba (18.7%, a difference of 0.75%).
| Demographics | Rating | Rank | Child Poverty Under the Age of 16 |
| Immigrants | Sudan | 0.8 /100 | #239 | Tragic 18.5% |
| Ghanaians | 0.8 /100 | #240 | Tragic 18.6% |
| Alsatians | 0.7 /100 | #241 | Tragic 18.6% |
| Immigrants | Laos | 0.6 /100 | #242 | Tragic 18.7% |
| Immigrants | Cuba | 0.6 /100 | #243 | Tragic 18.7% |
| Cape Verdeans | 0.6 /100 | #244 | Tragic 18.7% |
| Shoshone | 0.5 /100 | #245 | Tragic 18.8% |
| Immigrants | Nicaragua | 0.4 /100 | #246 | Tragic 18.8% |
| French American Indians | 0.4 /100 | #247 | Tragic 18.9% |
| Ecuadorians | 0.3 /100 | #248 | Tragic 19.0% |
| Potawatomi | 0.3 /100 | #249 | Tragic 19.0% |
| Immigrants | Middle Africa | 0.3 /100 | #250 | Tragic 19.0% |
| Immigrants | Ghana | 0.3 /100 | #251 | Tragic 19.1% |
| Immigrants | Trinidad and Tobago | 0.3 /100 | #252 | Tragic 19.1% |
| Salvadorans | 0.3 /100 | #253 | Tragic 19.1% |